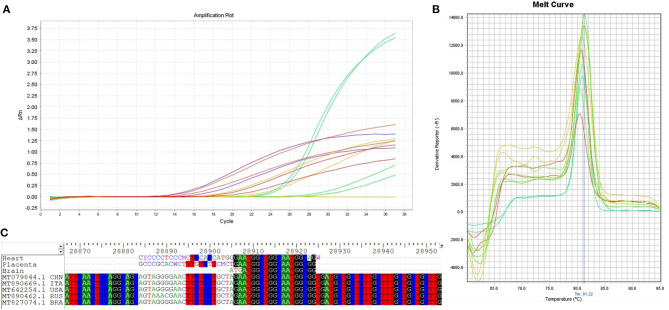
Figure 2.
Real-time PCR amplification, melt curves, and ssDNA sequencing of SARS-CoV-2 from different tissues of the newborn. (A) Amplification curve of SARS-CoV-2 in samples from the placenta, lung, heart, liver, and brain. (B) The melt curves showed a similar pattern for all SARS-CoV-2-positive amplifications detected in all tissues analyzed. (C) ssDNA sequencing of generated amplicons. The results obtained by sequencing the amplicons showed high homology with SARS-CoV-2 sequences. The homology analysis was performed using the entire genome sequences of copies of the SARS-CoV-2 virus from Russia (MT890462.1 RUS), USA (MT642254.1 USA), Italy (MT890669.1 ITA), China (MT079844.1 CHN), and Brazil (MT827074.1 BRA).

