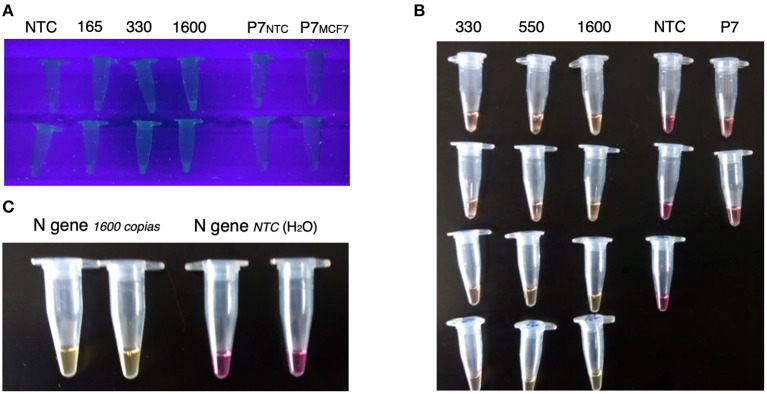
Figure 2.
Visual results of fluorescent and colorimetric LAMP systems. (A) Representative images of the visual inspection of LAMP fluorescent reactions using a UV transilluminator, fluorescence is perceived in the 66 and 320 copies/5 uL reactions. (B) Representative images of the LOD curves of colorimetric LAMP reactions, positive reactions change toward yellow, but negative ones remain pink. (C) Representative images of positive and negative colorimetric LAMP results.

