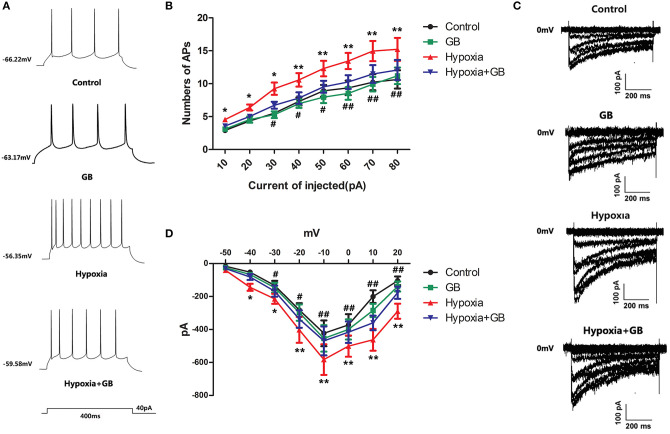
Figure 4.
GB reduced calcium currents in hippocampal neurons exposed to hypoxia in vivo. (A) Representative traces showing action potentials recorded from hippocampal neurons during the injection of a 40-pA depolarizing current for 400 ms. (B) Summary data for the number of action potentials (APs) recorded for each injected current amplitude for neurons in the control, GB, hypoxia and hypoxia+GB groups. (C) Representative traces showing calcium currents recorded from neurons in the control, GB, hypoxia and hypoxia+GB groups. (D) Current-voltage (I-V) curves obtained for neurons in the control, GB, hypoxia and hypoxia+GB groups. Data in (C) and (D) are expressed as the mean ± SEM (n = 9). *P < 0.05, **P < 0.01 for hypoxia group vs. control group; #P < 0.05, ##P < 0.01 for hypoxia+GB group vs. hypoxia group (one-way ANOVA and Bonferroni post-hoc test).

