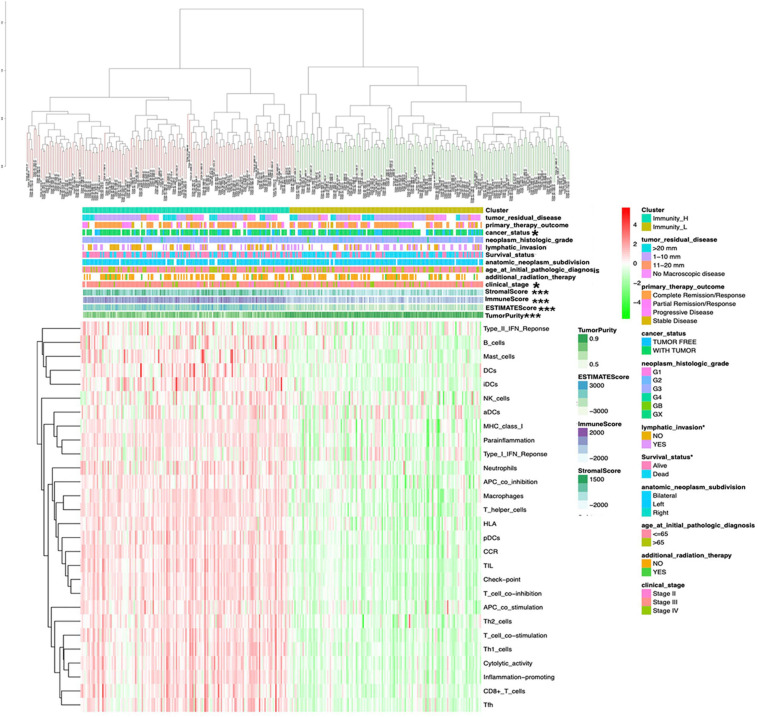
FIGURE 1.
The clinical and ESTIMATE algorithm association of immune clusters. The heatmap shows the OC samples were divided into two groups (immune relative high abundance of immune cells infiltration group and low abundance of immune cells infiltration group). The distribution of clinical features was compared between the high- and low-abundance immune groups. The association of ESTIMATE algorithm (including immunescore, stromalscore, and ESTIMATEscore) was compared between high- and low-risk immune groups. *p < 0.05, ***p < 0.001.

