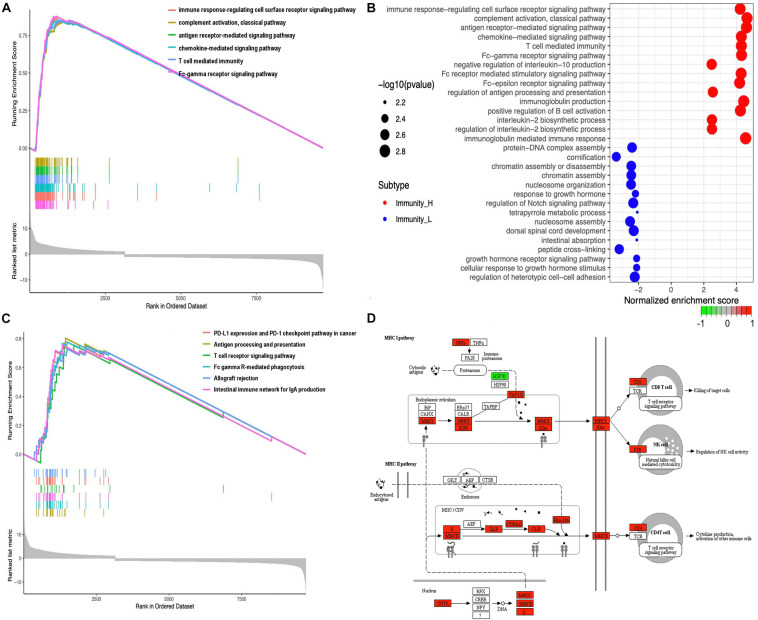
FIGURE 4.
Functional and pathway enrichment analyses. (A) The GO enrichment analysis in different expressed genes between the high- and low-abundance immune groups. Only gene sets with NOM p < 0.05 and FDR q < 0.05 (adjusted p-value using the Benjamini-Hochberg procedure to control the FDR) were considered significant. Only six leading gene sets were displayed in the plot. (B) The up- and downregulated GO pathways among immune subtypes by running a gene set enrichment analysis (GSEA) in different expressed genes. Enrichment P-values were based on 10,000 permutations and subsequently adjusted for multiple testing using the Benjamini-Hochberg procedure to control the FDR. (C) The KEGG enrichment analysis in different expressed genes between the high- and low-abundance immune groups. Only gene sets with NOM p < 0.05 and FDR q < 0.05 (adjusted p-value using the Benjamini-Hochberg procedure to control the FDR) were considered significant. Only six leading gene sets were displayed in the plot. (D) MHC-I pathway as an example for enriched KEGG.

