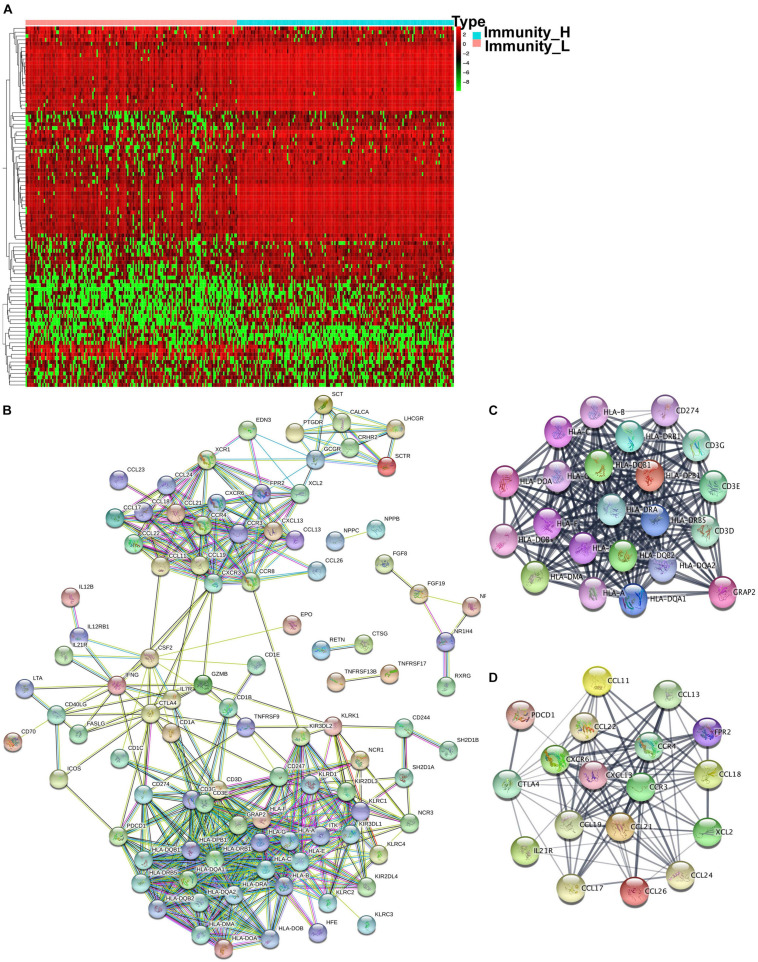
FIGURE 5.
The different expressed immune-related genes and PPI network in OC tissues. (A) The heatmap of OC tissues and the different expressed immune-related genes between the high- and low-abundance immune groups. (B) PPI network of those different expressed immune-related genes. (C,D) Hub modules were analyzed using MCODE (module 1 score = 20.09 and module 2 score = 11.75).

