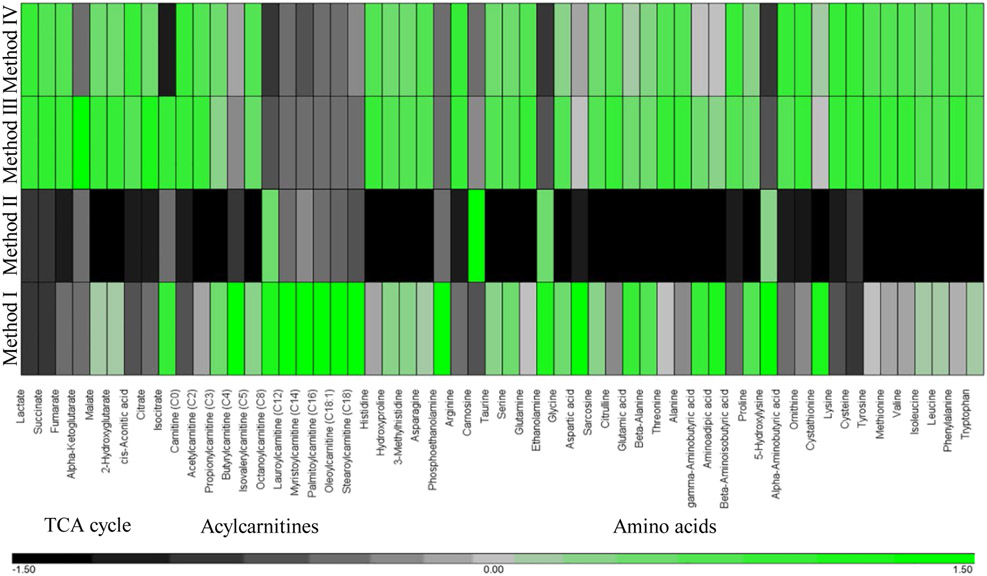
Fig. 3.
Hierarchical clustering showing relative concentrations of metabolites in skin fibroblasts collected by Methods I – IV. The average metabolite value obtained for each Method was used for the analysis. Each row represents a different collection Method and columns signify a metabolite. The green and black colors indicate higher and lower metabolite abundances, respectively.

