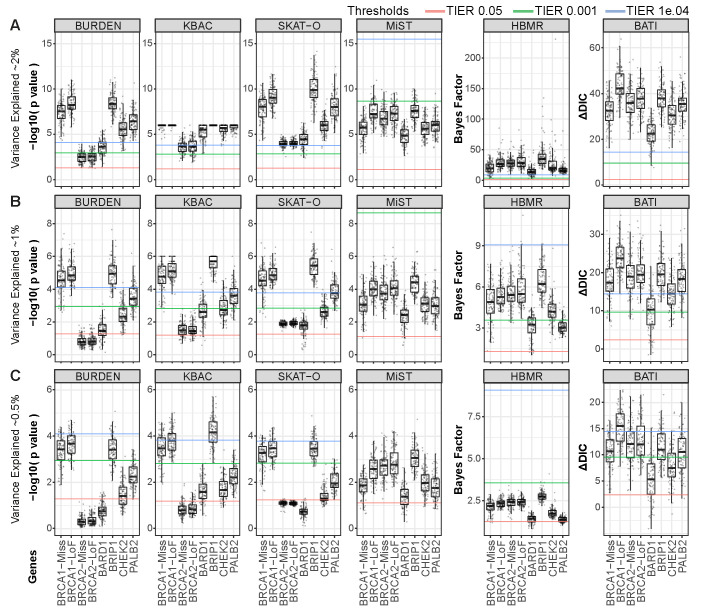
Fig 3. Benchmarking statistical power to detect rare variant associations for 8 genes individually.
Rare variants annotated for increased breast cancer risk were simulated into the 1000GP dataset following a rare variant etiology by ethnicity scenario. Samples were separated into populations according to 1000GP annotation and each variant from the pool of ClinVar and HGMD variants was assigned to one of the super populations; EUR+AMR, SAS or EAS. Power (y-axis) per gene for 6 methods (Burden, KBAC, SKAT-O, MiST, HBMR and BATI) is shown for (A) 2%, (B) 1%, and (C) 0.5% variance explained between cases and healthy controls. Lower, middle and upper lines indicate relaxed (5%), medium (0.1%) and strict (0.01%) TIER thresholds, respectively.

