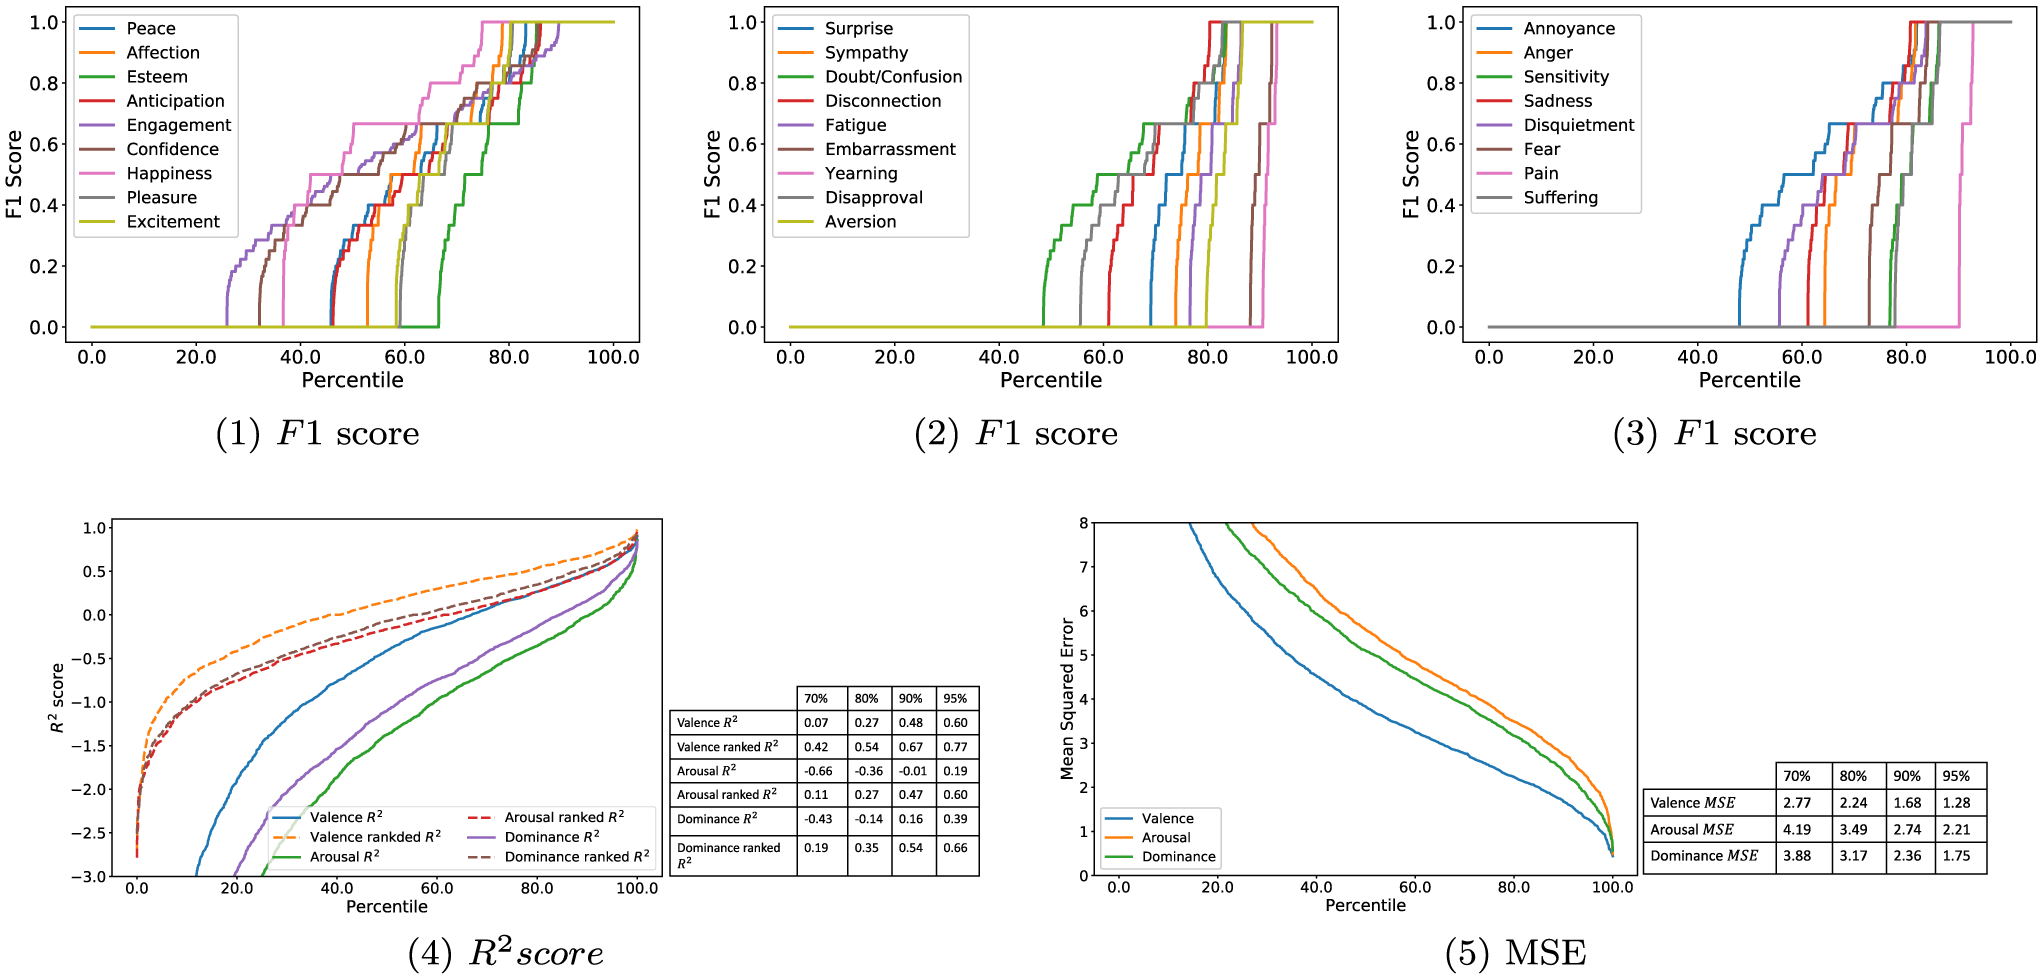
Fig. 11.

Human regression performance on dimensional emotions. X-axis: participant population percentile. Y-axis: F1, R2 and MSE score. Tables inside each plot in the second row summarize top 30%, 20%, 10%, and 5% participant regression scores

Human regression performance on dimensional emotions. X-axis: participant population percentile. Y-axis: F1, R2 and MSE score. Tables inside each plot in the second row summarize top 30%, 20%, 10%, and 5% participant regression scores