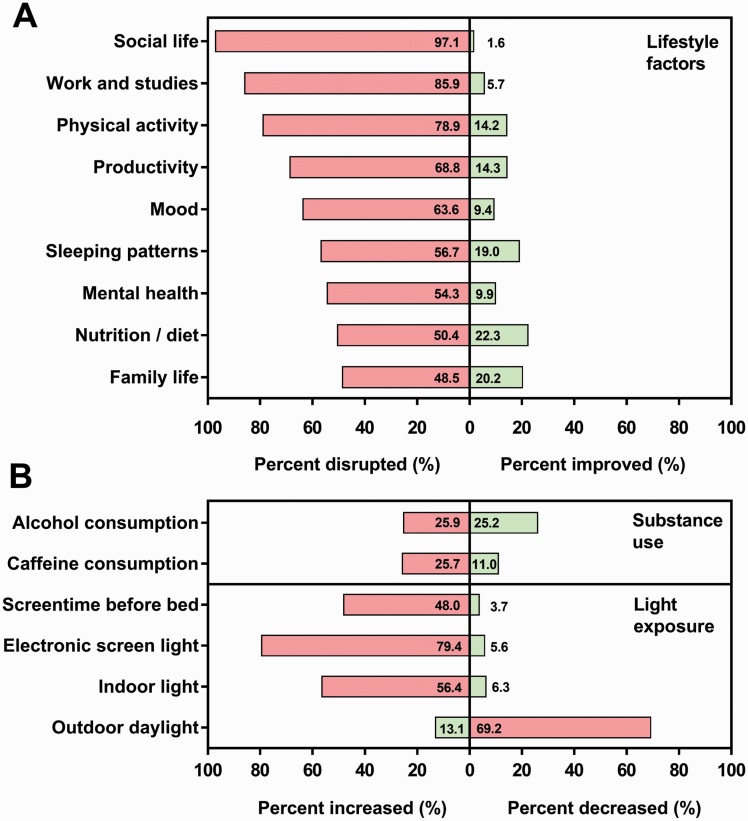
Figure 1.
Changes to lifestyle factors (A), substance use, and light exposure (B) in athletes as a result of the COVID-19 pandemic and associated lockdown restrictions. Frequency is shown as the percentage of sample (%). Health and lifestyle disruptions are represented as percent disrupted and improved. Substance use and light exposure are represented as percent increased and decreased. Bars with percentage values indicate negatively associated changes (red) and positively associated changes (green). Responses coded as “no change,” that is, not disrupted or improved, are not included so the total value of each category may not add up to 100.

