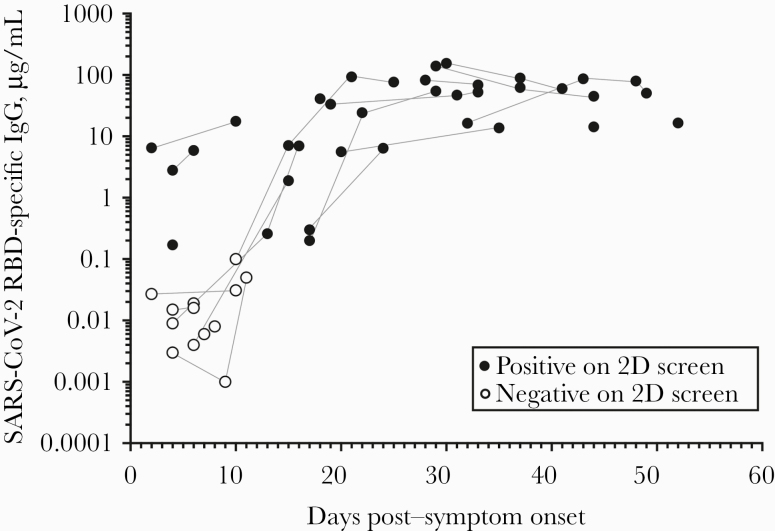
Figure 4.
Kinetics and magnitude of antiviral antibody responses to SARS-CoV-2. Quantitative analysis of SARS-CoV-2-specific IgG shows that among hospitalized cases with COVID-19, these antibodies increase with time and plateau by ~4 weeks post–symptom onset. Open symbols represent samples that scored negative based on the 2-dimensional ELISA, and closed symbols represent samples that scored positive based on the 2-dimensional ELISA in Figure 3A. Samples obtained from the same study subject are connected by gray lines. Abbreviations: ELISA, enzyme-linked immunosorbent assay; COVID-19, coronavirus disease 2019; IgG, immunoglobulin G; SARS-CoV-2, severe acute respiratory syndrome coronavirus 2.

