Figure 5.
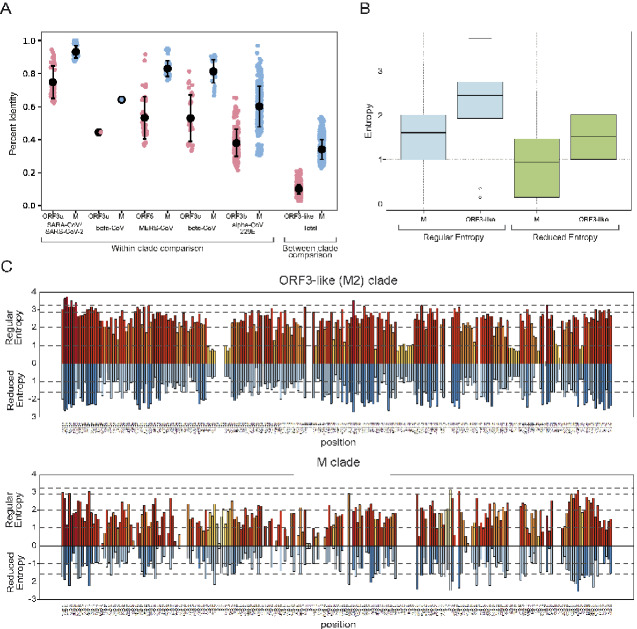
(A) Percent identity comparison between the coupled M and ORF3-like (M2) proteins within different viral clades and between different clades. (B) A boxplot comparing the distribution column-wise Shannon entropy between the M and ORF3-like (M2) proteins from the same set of viral genomes based on regular alphabet of 20 amino acids and reduced alphabet of 8 symbols. The box in the plot indicates the first quartile, the second quartile (median), and the third quartile. The whiskers indicate the min and max entropy values excluding outliers; and if a value is lower or greater than the distance of 1.5 times the interquartile range, they are plotted as outliers shown as dots in the plot. (C) The column-wise entropy values for each column in the alignment of the M and ORF3-like (M2) proteins from the same set of viral genomes. Shannon entropy computed based on the regular amino acid alphabet (20 amino acids) is shown above the zero line in shades of orange, while Shannon entropy computed based on a reduced alphabet of 8 symbols are shown below the zero line in shades of blue. Those positions showing high entropy in both alphabets are under potential diversifying selection for amino acids of different chemical character.

