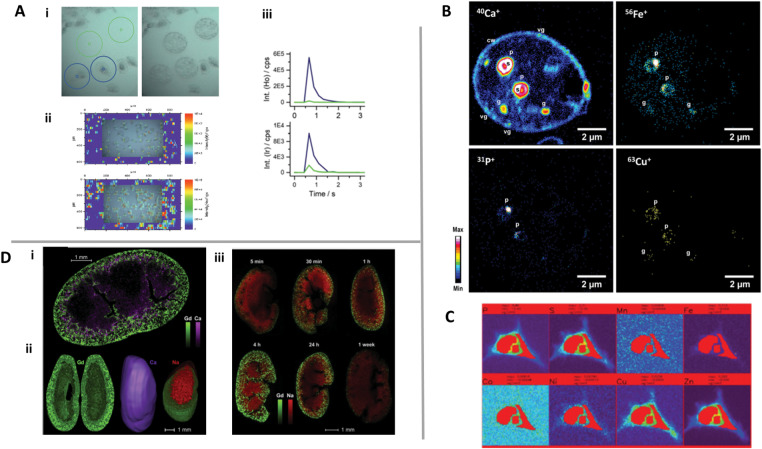
Fig. 7.
Multi-elemental imaging on single cells using: (A) LA-ICP-MS, wherein (i) and (iii) are measurements of the single cell spot (blue circle) and blanks (green circle), and (ii) is the constructed image. Adapted with permission from162 Marketplace (2020) Royal Society of Chemistry; (B) NanoSIMS with an O− RF plasma primary ion source. Adapted with permission from,170 Copyright (2020) Elsevier; (C) SR-μXRF. Adapted with permission from,170 Marketplace (2020) Royal Society of Chemistry and (D) LIBS, where (i) represents the 2-D high resolution elemental map of Gd (green) and Ca (purple); (ii) represents 3-D distribution of Gd (green) and Ca (purple); (iii) elemental images of Gd (green) and Na (red) in the kidneys at different times. Adapted with permission from173 Copyright (2020) Elsevier.

