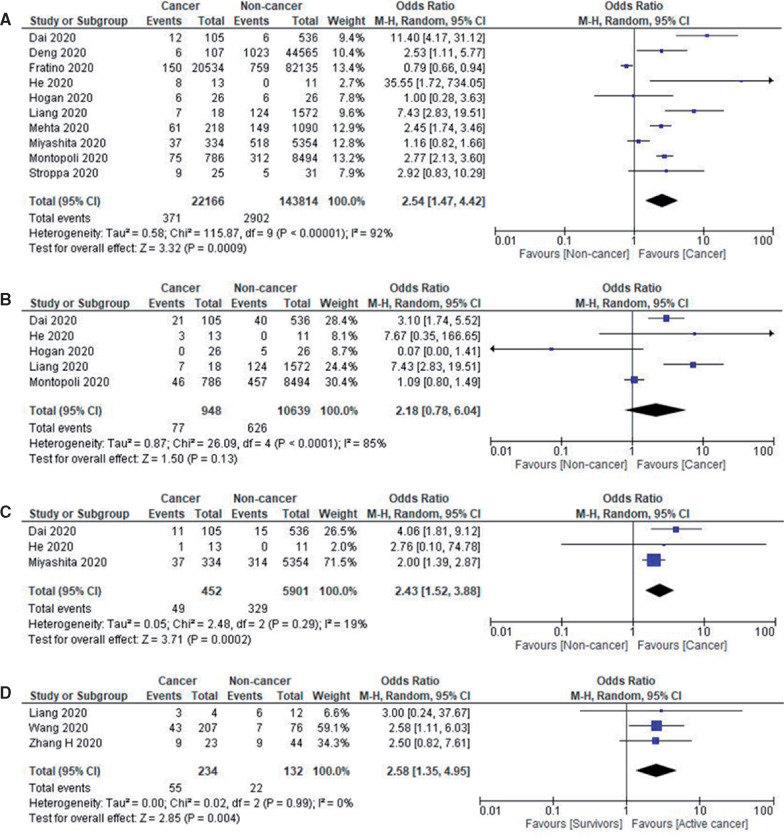
Figure 2:
Prognosis of patients with COVID-19. A) Forest plot of pooled in-hospital all-cause mortality rates between cancer patients and noncancer patients. B) Forest plot of intensive care unit admission rates between cancer patients and noncancer patients. C) Forest plot of intubation rates between cancer patients and noncancer patients. D) Forest plot of severe disease between active cancer patients and cancer survivors. Odds ratio calculated using the Mantel-Haenszel random-effects model and P value from the z test to examine whether the pooled estimate of effect is statistically significant. CI = confidence interval; M-H = Mantel-Haenszel Test.

