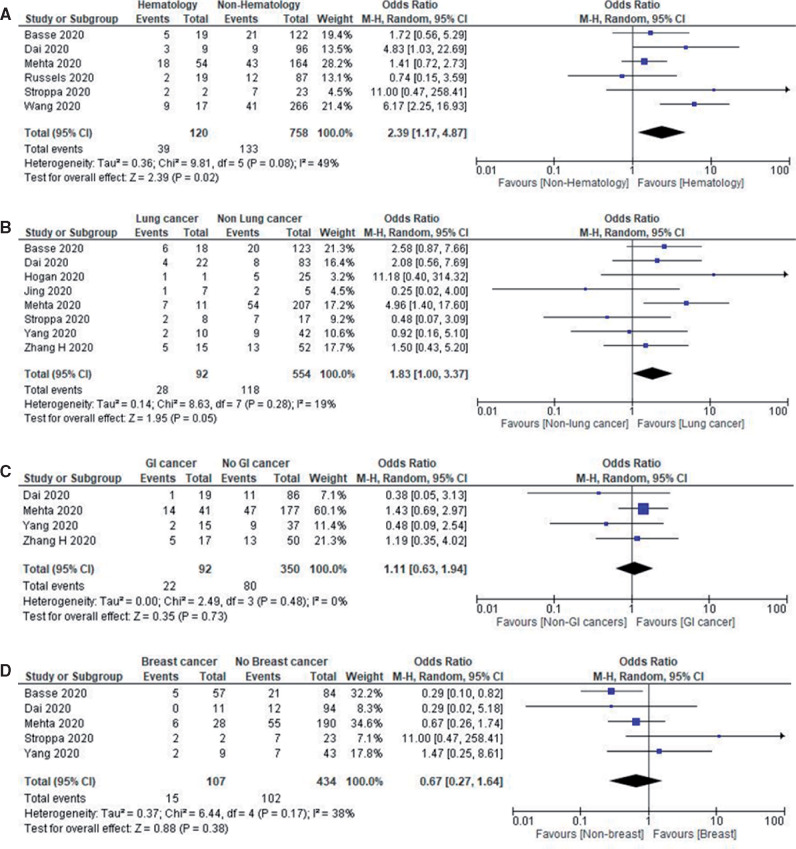
Figure 3.
Mortality outcomes in cancer subtypes with COVID-19. A) Forest plot of pooled in-hospital all-cause mortality rates between hematological cancer patients and nonhematological cancer patients. B) Forest plot of pooled in-hospital all-cause mortality rates between lung cancer patients and nonlung cancer patients. C) Forest plot of pooled in-hospital all-cause mortality rates between gastrointestinal cancer patients and nongastrointestinal cancer patients. D) Forest plot of in-hospital all-cause mortality rates between breast cancer patients and nonbreast cancer patients. Odds ratio calculated using the Mantel-Haenszel random-effects model and P value from the z test to examine whether the pooled estimate of effect is statistically significant. CI = confidence interval; M-H = Mantel-Haenszel Test.

