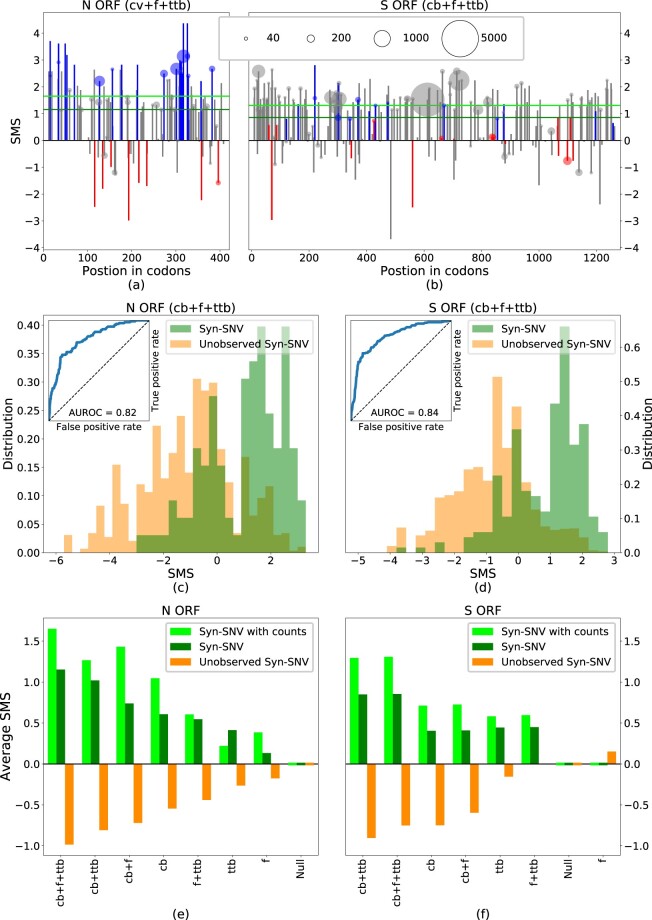
Fig. 5.
SMS differentiates syn-SNV from unobserved syn-SNV. (a, b) SMS for syn-SNV with the full model including codon bias (cb), CpG force (f), and transition-transversion bias (ttb) in the N and S ORFs. Blue, red, and gray bars denote mutations decreasing, increasing, or leaving unchanged the CpG content. The area of circles, shown on SNV observed more than 20 times in the data set, is proportional to the SNV count. Green, horizontal lines are the average SMS of the syn-SNV with (dark green) and without (light green) counts. (c, d) Histograms of SMS distribution for observed (green) and unobserved (orange) syn-SNV in the N and S ORFs with the full model (cb + f + ttb). The corresponding ROC curve is given as an inset, together with the AUROC. (e, f) Average SMS for syn-SNV (dark green), syn-SNV with SNV-counts (light green), and for unobserved syn-SNV (orange) computed with the full model and all possible reduced models. In the null model (Null), all synonymous mutations are equiprobable. Models are ranked according to the difference of average SMS for observed and unobserved syn-SNV. Data from GISAID (Elbe and Buckland-Merrett 2017), see Materials and Methods for details on data analysis (last update October 05, 2020). Wuhan ancestral genome has GISAID ID: EPI_ISL_406798. SNV with <5 counts are considered as unobserved syn-SNV.

