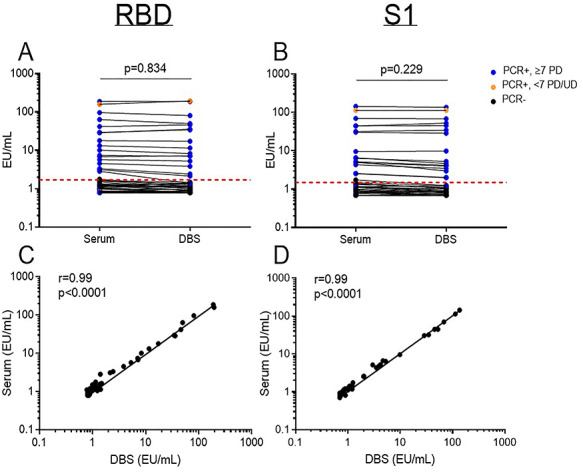
Fig. 1.

Comparison of serum and dried blood spot (DBS) ELISA for the receptor-binding domain (RBD) and spike domain 1 (S1) of the SARS-CoV-2 spike protein. Concentration of (A) RBD- and (B) S1-specific IgG paired analysis. Correlation of (C) RBD- and (D) S1- specific IgG between serum and DBS specimens. Data are presented as mean ± 95% CI and each point is an individual sample. The dotted line represents the cut-off for seropositivity based on pre-pandemic sera plus two standard deviations. PCR+/−: SARS-CoV-2 polymerase chain reaction status. PD: post-PCR diagnosis. UD: undetermined. EU: ELISA Units. r: correlation coefficient.
