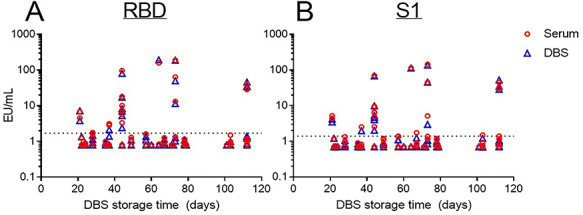
Fig. 2.

Effect of DBS storage duration on the measurement of (A) RBD- and (B) S1- specific IgG response for all DBS specimens (blue) and their corresponding serum samples (red) based on DBS storage time (n = 95) Paired t-test and Pearson’s correlation analysis were performed for IgG concentrations and correlation analysis, respectively. The dotted line represents the cut-off for seropositivity based on pre-pandemic sera plus two standard deviations.
