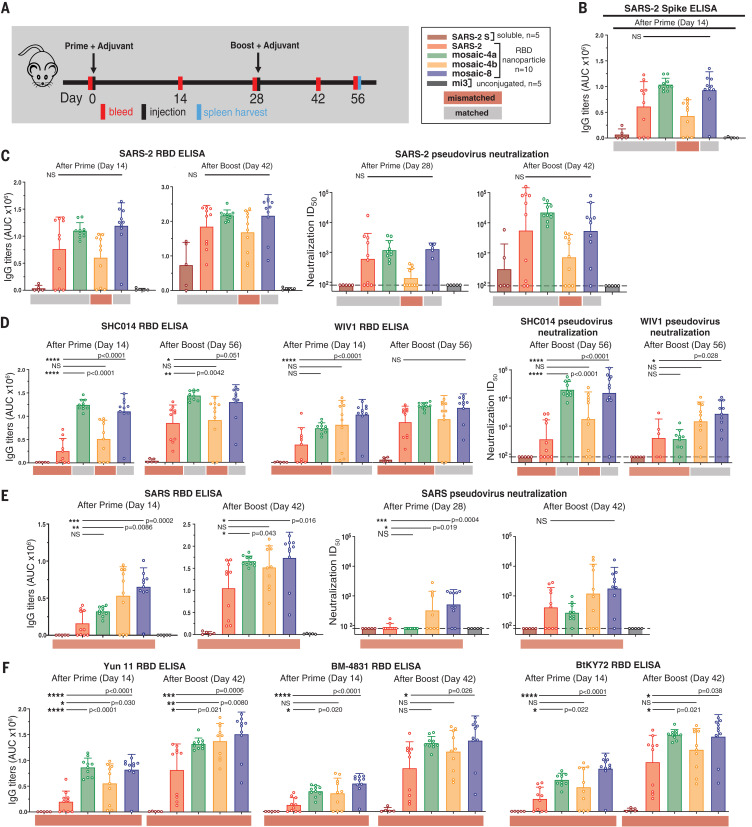
Fig. 3. RBD nanoparticles induce cross-reactive IgG responses in immunized mice.
Red and gray rectangles below ELISA and neutralization data represent mismatched strains (red; RBD from that strain was not present on the immunized particle) or matched strains (gray; RBD was present on the immunized particle). (A) Left: Immunization schedule; adjuvant is AddaVax (Invivogen). Right: Key for immunizations; number of mice in each cohort is indicated. (B to F) Neutralization and/or binding data for serum IgGs for recognition of (B) SARS-2 spike trimer, (C) SARS-2 RBD and SARS-2 pseudovirus, (D) SHC014 and WIV1 RBDs and corresponding pseudoviruses, (E) SARS RBD and SARS pseudovirus, and (F) Yun11, BM-4831, and BtKY72 RBDs. Mice were immunized with soluble SARS-CoV-2 S trimer (SARS-2 S; brown bars) or the following nanoparticles: homotypic SARS-2 (red), mosaic-4a (green), mosaic-4b (yellow), mosaic-8 (blue), or unconjugated SpyCatcher003-mi3 (mi3; black). ELISA data from serum IgG responses to SARS-2 spike trimer (B) or RBDs [(C) to (F)] are shown as area under the curve (AUC). For (C) to (E), neutralization potencies are presented as half-maximal inhibitory dilutions (ID50 values) of sera against the pseudoviruses from the indicated coronavirus strains. Dashed horizontal lines correspond to the lowest dilution representing the limit of detection. Each dot represents serum from one animal, with means and SDs for vaccinated cohorts denoted by rectangles and horizontal lines, respectively. Significant differences between groups linked by horizontal lines are indicated by asterisks and P values. NS, not significant.

