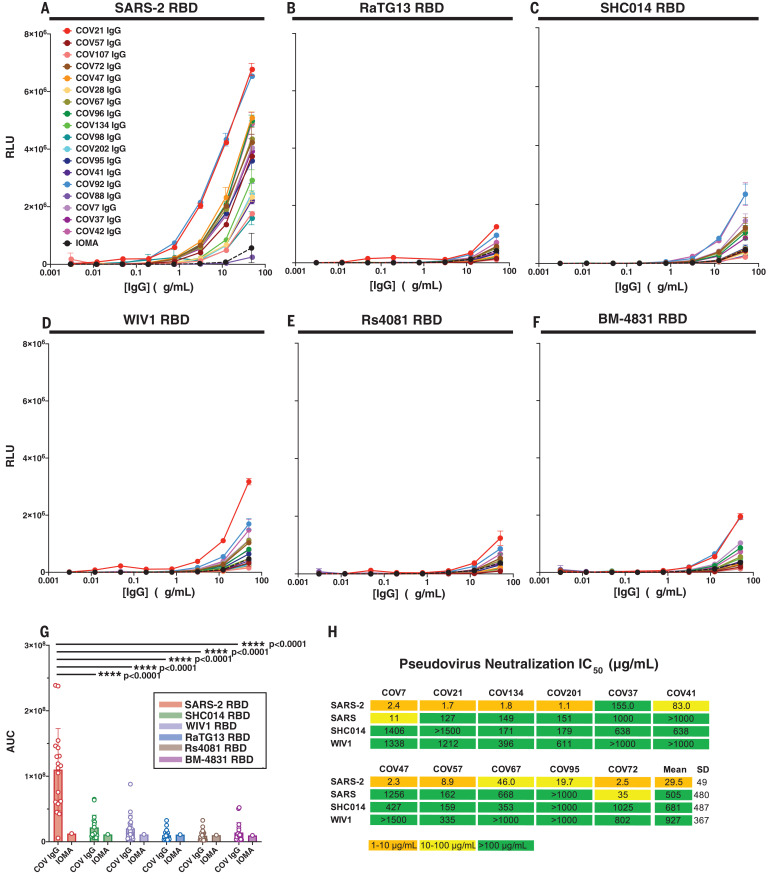
Fig. 4. IgGs from convalescent COVID-19 plasma show little to no cross-reactive responses.
(A to F) Plasma IgG (18, 24) responses were evaluated by ELISA [data shown as binding curves with plasma names (18) listed] against RBDs from (A) SARS-2, (B) RaTG13, (C) SHC014, (D) WIV1, (E) Rs4081, and (F) BM-4831. Data points are plotted as means ± SD of duplicate measurements. IOMA, an anti–HIV-1 IgG (50), was used as a control. (G) ELISA results from (A) to (F), presented as AUC; each dot represents one plasma sample, with means ± SD shown as colored bars. Significant differences between groups linked by horizontal lines are indicated by asterisks and P values. (H) IC50 values for pseudotyped neutralization assays using IgGs from COV7, COV21, and COV72 plasmas (18) (evaluated at top concentrations of 1500 μg/ml) against the indicated strains. Mean = arithmetic mean IC50.

