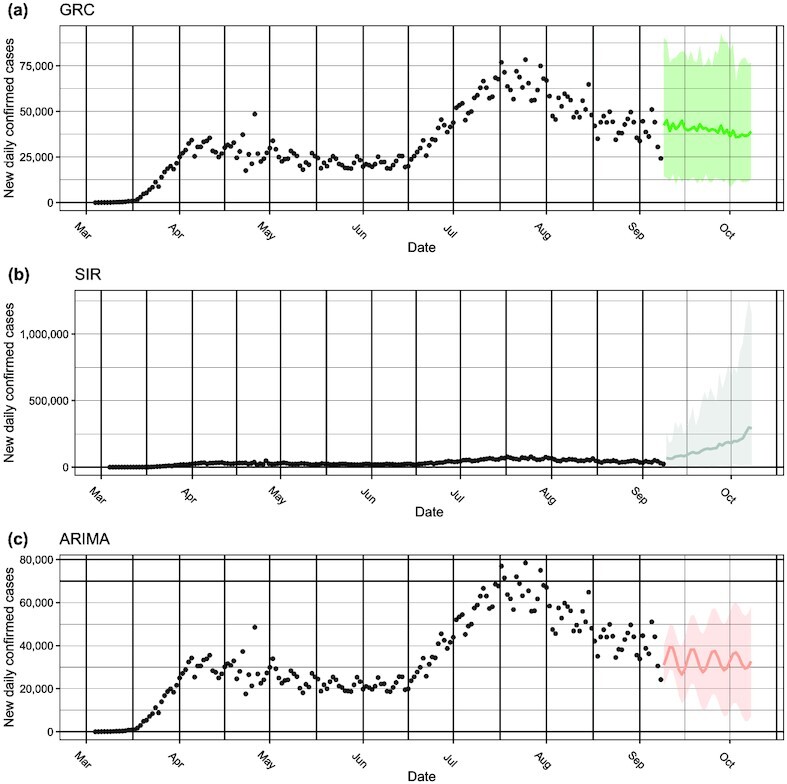
Figure 1:

The 1-month forecasting of new daily confirmed COVID-19 cases in the USA made by the (a) GRC and (b) SIR model under the proposed Bayesian framework, as well as the benchmark (c) ARIMA model. The black circles represent the observed COVID-19 case numbers since early March 2020, while the colored circles and ribbons represent the predicted means and  prediction intervals, respectively.
