Figure 4:

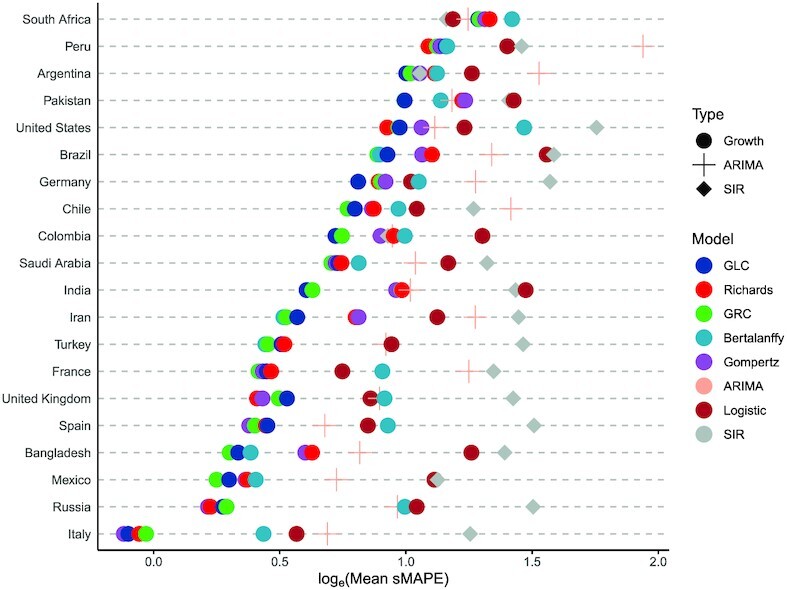
The Cleveland dot plot of the averaged sMAPE generated by the rolling-origin cross-validation (ROCV) for the 20 countries with the most confirmed COVID-19 case numbers as of August 22, 2020.

The Cleveland dot plot of the averaged sMAPE generated by the rolling-origin cross-validation (ROCV) for the 20 countries with the most confirmed COVID-19 case numbers as of August 22, 2020.