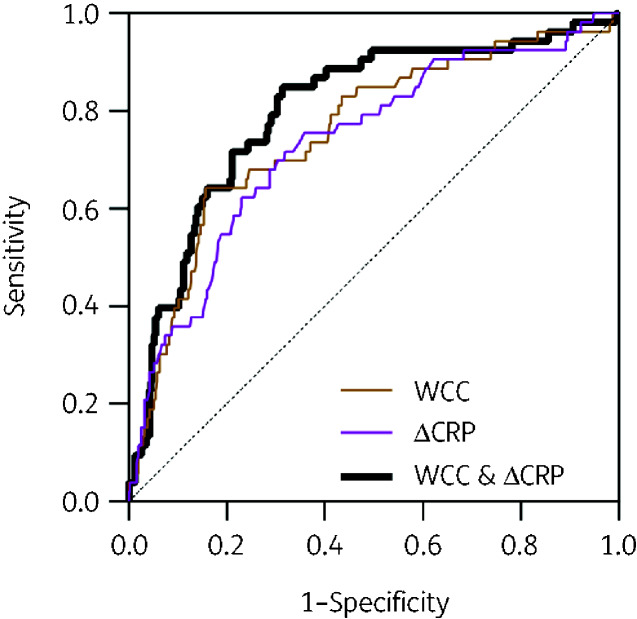
Figure 3.
Accuracy of blood parameters to diagnose CAP in RFH cohorts of CAP and MR− COVID-19 patients. ROC curves generated from logistic regression models that incorporate combinations of WCC on admission and difference (Δ) in CRP between samples on admission and 48–72 h into admission in order to discriminate RFH patients diagnosed with CAP from those diagnosed with COVID-19. This figure appears in colour in the online version of JAC and in black and white in the print version of JAC.

