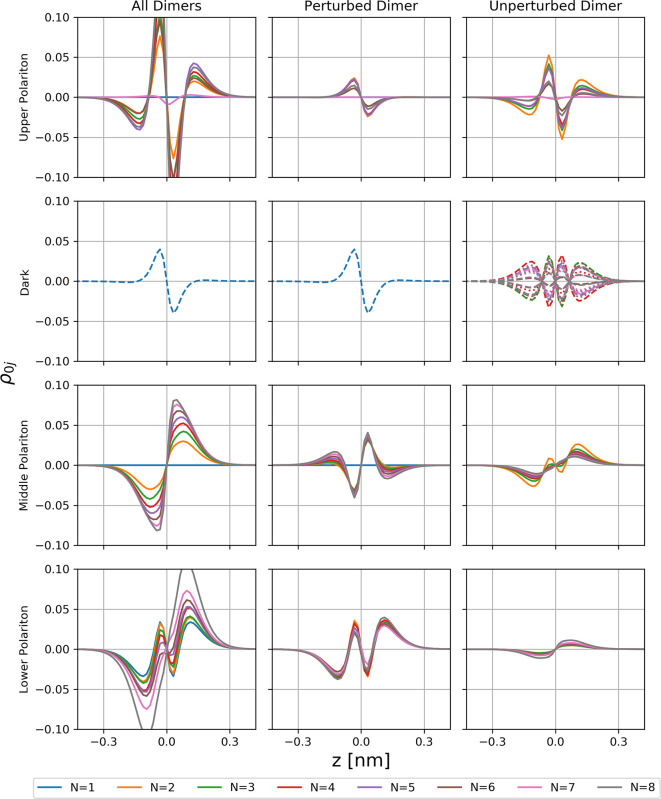
Figure 4.
Globally (left column) and locally resolved transition densities projected onto the z-axis for different chain lengths N in coupling regime II. For each of the four energy windows (rows), integrated quantities are displayed, except for the dark states. The integration cleans the data and contributes only very little to the overall results, except for N = 7, that is, in the vicinity of the observed splitting of the upper polaritonic branch.

