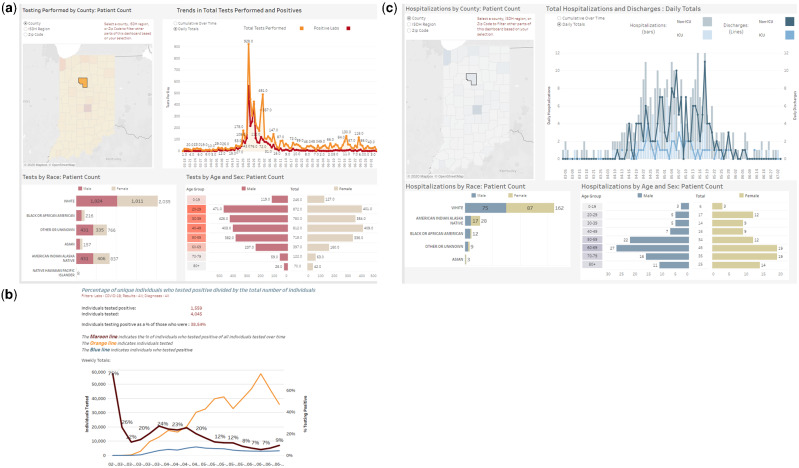
Figure 4.
A series of 3 panels representing how the Regenstrief COVID-19 Dashboard was used to examine a localized coronavirus disease 2019 (COVID-19) outbreak in Cass County, Indiana. (A) The component of the dashboard that monitors COVID-19 laboratory tests and their results. (B) A rollover chart that displays weekly testing figures, including the number of individuals tested, the number of individuals testing positive, and the calculated test positivity. (C) The component of the dashboard that visualizes hospitalization data for individuals with COVID-19. Admissions and discharges are included in the graph as well as critical care utilization.

