
Figure 3.
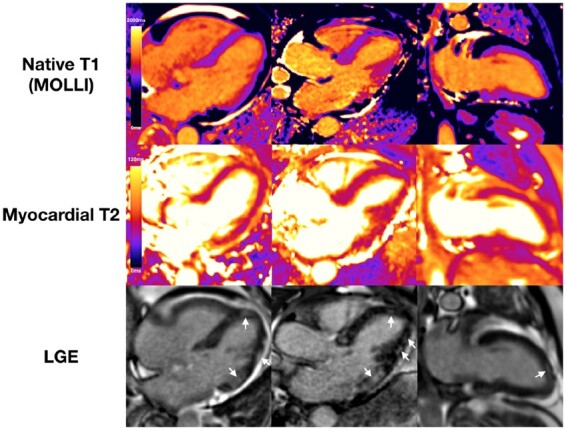
Example of patient with a myocarditis-pattern late gadolinium enhancement and evidence of active inflammation. Native T1 and myocardial T2 were elevated in the inferolateral wall (T1 1261 ms, T2 56 ms) and normal in the basal inferoseptum (T1 983 ms, T2 50 ms). Late gadolinium enhancement imaging shows patchy areas of subepicardial enhancement in the lateral wall and basal inferior wall, and mid-wall enhancement in the distal septum and distal anterior wall (white arrows).