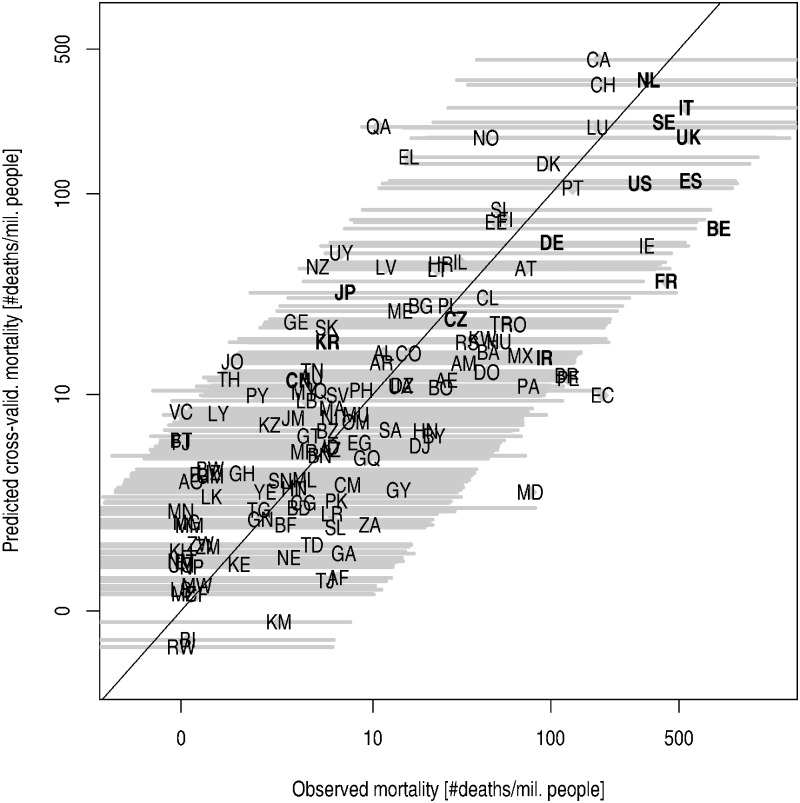
Figure 1.
Comparison of observed and predicted mortality using the final model. (A) Cross-validated predicted mortalities (i.e. calculated using a model estimated while leaving out the country for which prediction is calculated), including the 95% prediction interval (yellow bars), plotted against observed mortalities in countries under consideration. (B) With the exclusion of Qatar, Japan and Belgium. Model parameters estimated using N = 135 observations (Qatar, Japan, and Belgium excluded). The following countries are highlighted on the plot: JP, Japan; CN, China; KR, South Korea; IR, Iran; CZ, Czech Republic; DE, Germany; US, U.S.A.; FR, France; ES, Spain; BE, Belgium; SE, Sweden; UK, the United Kingdom; IT, Italy; NL, the Netherlands. Explanation of the country codes could be found in Supplementary table S.2

