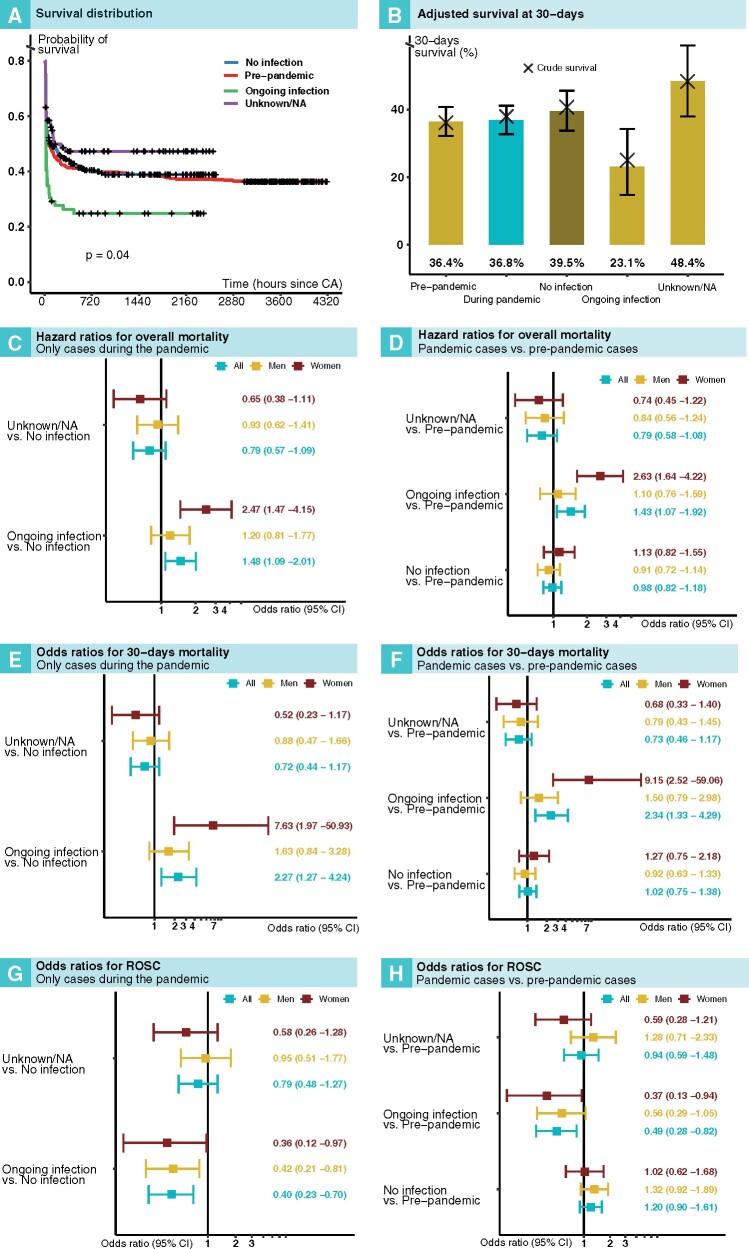
Figure 2.
Outcomes after in-hospital cardiac arrest in relation to COVID-19 status and period. (A) Kaplan–Meier plot for all groups. (B) Adjusted (predicted) 30-day survival for all groups. Survival in relation to COVID-19 status during the pandemic is shown in (C), (E), and (G). Survival in relation to COVID-19 status during the pandemic, as compared with the pre-pandemic period, is shown in (D), (F), and (H).

