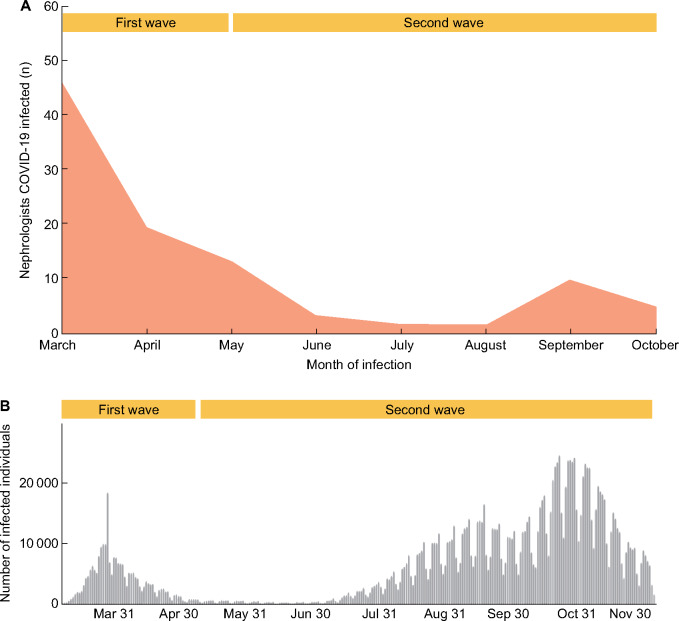
FIGURE 1:
COVID-19 pandemic in Spain. (A) Number of SARS-CoV-2-infected nephrologists as per the present survey. The number of nephrologists infected per month is represented, with data points connected by straight lines. (B) Number of SARS-CoV-2 infections in Spain. Weekly number of infected individual represented as per the World Health Organization (https://covid19.who.int/region/euro/country/es; 8 December 2020, date last accessed).

