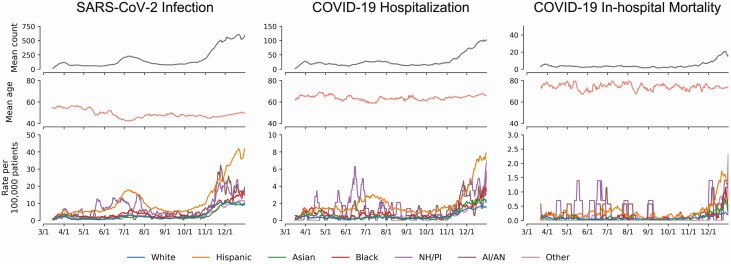
Figure 1.
Characteristics of COVID-19 patients over time (rolling 7-day average). Left column represents patients who have tested positive for SARS-CoV-2 infection; middle column represents patients who have been hospitalized for COVID-19; and right column represents COVID-19 hospitalized patients who experienced in-hospital death. The first row of each column represents the rolling 7-day mean count of patients for the event; the second row represents the rolling 7-day mean age of patients; and the third row represents the 7-day mean rate of event per 100 000 patients. Rate per 100 000 patients were calculated out of total patients under care since 2019 for each race/ethnicity. Abbreviations: COVID-19, coronavirus disease 2019; SARS-CoV-2, severe acute respiratory syndrome coronavirus 2.

