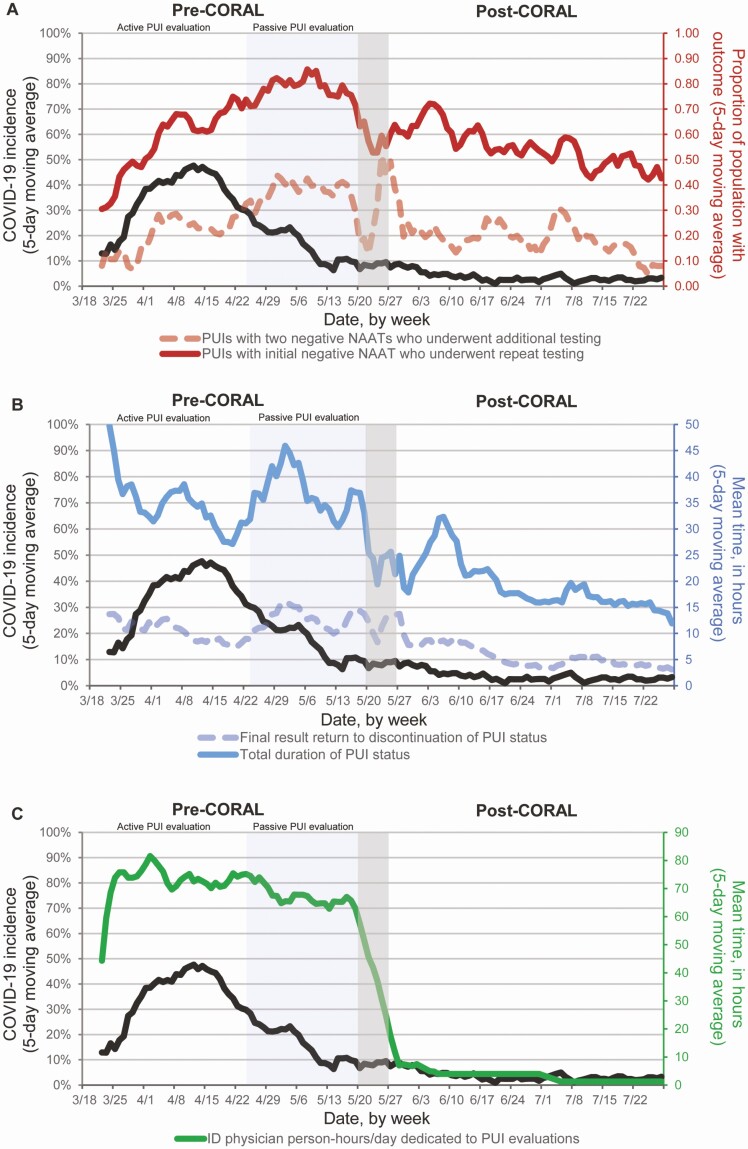
Figure 3.
Daily changes in key outcomes in the periods before and after implementation of the COvid Risk cALculator (CORAL) relative to coronavirus disease 2019 (COVID-19) incidence. The pre-CORAL period (left) is shown with the active evaluation window for persons under evaluation for COVID-19 (PUIs), from 18 March to 23 April 2020, and the passive PUI evaluation window from 24 April to 19 May (Methods). CORAL was launched on 20 May 2020, followed by a 1-week transition period, with the post-CORAL period spanning 27 May to 28 July 2020. The incidence of new COVID-19 diagnoses among hospitalized PUIs, shown as a 5-day moving average, is shown in black (left y-axis) in all panels. (Dates are given in month/date format.) A, Proportion of PUIs with an initial negative nucleic acid amplification test (NAAT) result who underwent repeated testing (solid red line; right y-axis) and the proportion of PUIs with 2 negative NAAT results who underwent additional testing (dashed red line; right y-axis). B, Mean total duration of PUI status (solid blue line; right y-axis) and the mean time from final negative NAAT result return to PUI status discontinuation (dashed blue line; right y-axis). C, Mean infectious diseases (ID) physician person-hours/day dedicated to PUI evaluations (solid green line; right y-axis). Of note, we excluded patients who became PUIs during the pre-CORAL or wash-in period, but who had resolution of CoV-Risk status with CORAL, owing to the duration of their PUI status; the greater fluctuation in results around the end of the pre-CORAL and wash-in period is likely because fewer patients were contributing to the data set in those weeks.

