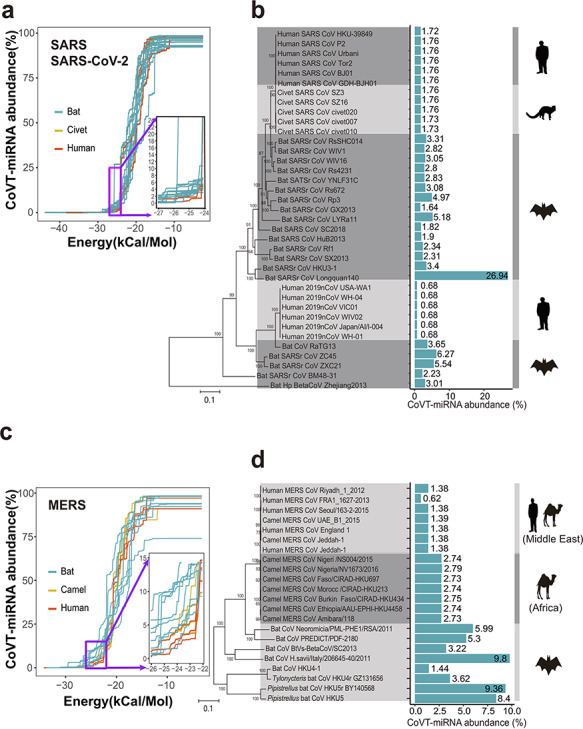
Figure 1.

Comparison of the total abundance of coronavirus-targeting miRNAs (CoVT-miRNAs) between coronavirus strains of human and nonhuman hosts. (a and b) CoVT-miRNA abundance for strains in group 2b of beta-coronavirus, which includes SARS-CoV, SARS-CoV-2, and SARS-related coronaviruses. (a) The accumulation curves of CoVT-miRNA abundance for each strain when gradually relaxed based on minimal free energy predictions. Each curve indicates a coronavirus strain with red, yellow and blue curves, representing human, civet, and bat strains, respectively. Inset, an enlarged region showing the first inflection point of the predicted CoVT-miRNA abundance curves. (b) CoVT-miRNA abundance of each strain in a phylogenetic context. Blue bars indicate the CoVT-miRNA abundance of each strain in the dendrogram at the free energy cutoff of −25 kcal/mol with the values labeled alongside. The cartoons on the right show the animal species of the host of the strains in each clade. (c and d) CoVT-miRNA abundance for strains in group 2c of beta-coronavirus, which includes MERS-CoV and MERS-related CoVs. (c) The accumulation curves of CoVT-miRNA abundance for each strain. Red and blue curves represent strains of human and nonhuman host, respectively. The inset highlights details of the first inflection points of the accumulation curves. (d) CoVT-miRNA abundance for each strain of this group in a phylogenetic context.
