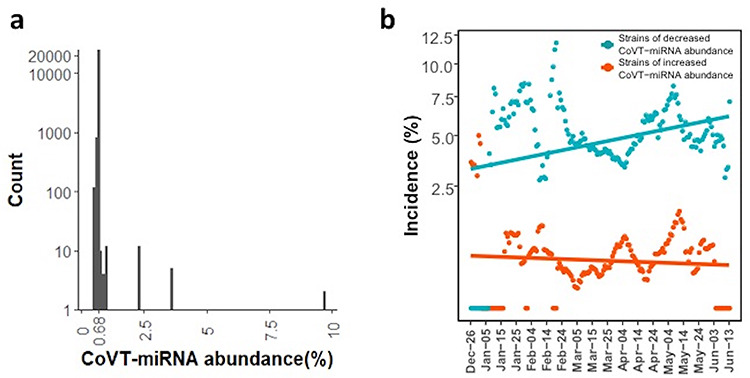
Figure 4.

CoVT-miRNA abundance of SARS-CoV-2. (a) The number of SARS-CoV-2 strains as a function of CoVT-miRNA abundance. The highest peak is at 0.68%, accounted for 92.03% of the total. The number of strains with decreased and increased CoVT-miRNA abundance is 1890 (7.18%) and 206 (0.78%), respectively. (b) The incidence of strains with decreased (turquoise dots) and increased (red dots) CoVT-miRNA abundance. The incidence of the two strain types is calculated as the respective proportion of the total collection in a 10-day window and plotted against the SARS-CoV-2 epidemic since 26 December 2019 with a 1-day step. Turquois and red lines indicate the linear regression of the incidences of strains with decreased and increased CoVT-miRNA abundance, respectively. Pearson correlation is used to evaluate their correlations to the time course, and the incidence of decreased CoVT-miRNA abundance is significantly correlated (rho = 0.30, P = 8.7 × 10⁻⁵) but not that of the incidence of increased CoVT-miRNA abundance (rho = −0.083, P = 0.28).
