© The Author(s) 2021. Published by Oxford University Press. All rights reserved. For Permissions, please email: journals.permissions@oup.com
This article is made available via the PMC Open Access Subset for unrestricted re-use and analyses in any form or by any means with acknowledgement of the original source. These permissions are granted for the duration of the COVID-19 pandemic or until permissions are revoked in writing. Upon expiration of these permissions, PMC is granted a perpetual license to make this article available via PMC and Europe PMC, consistent with existing copyright protections.
This article is published and distributed under the terms of the Oxford University Press, Standard Journals Publication Model (https://academic.oup.com/journals/pages/open_access/funder_policies/chorus/standard_publication_model)

 ’ and ‘
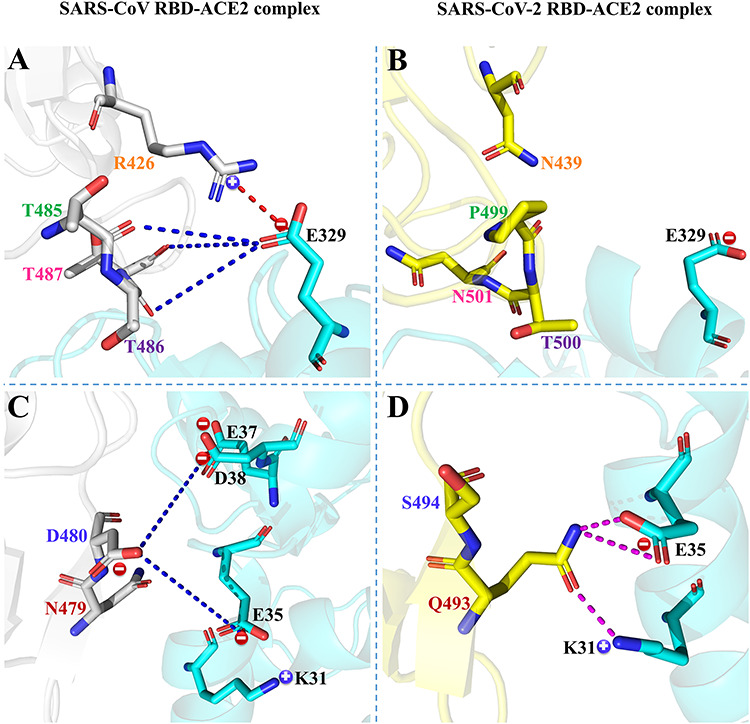
 ’ represent positively and negatively charged residues, respectively.