
Fig. 6.
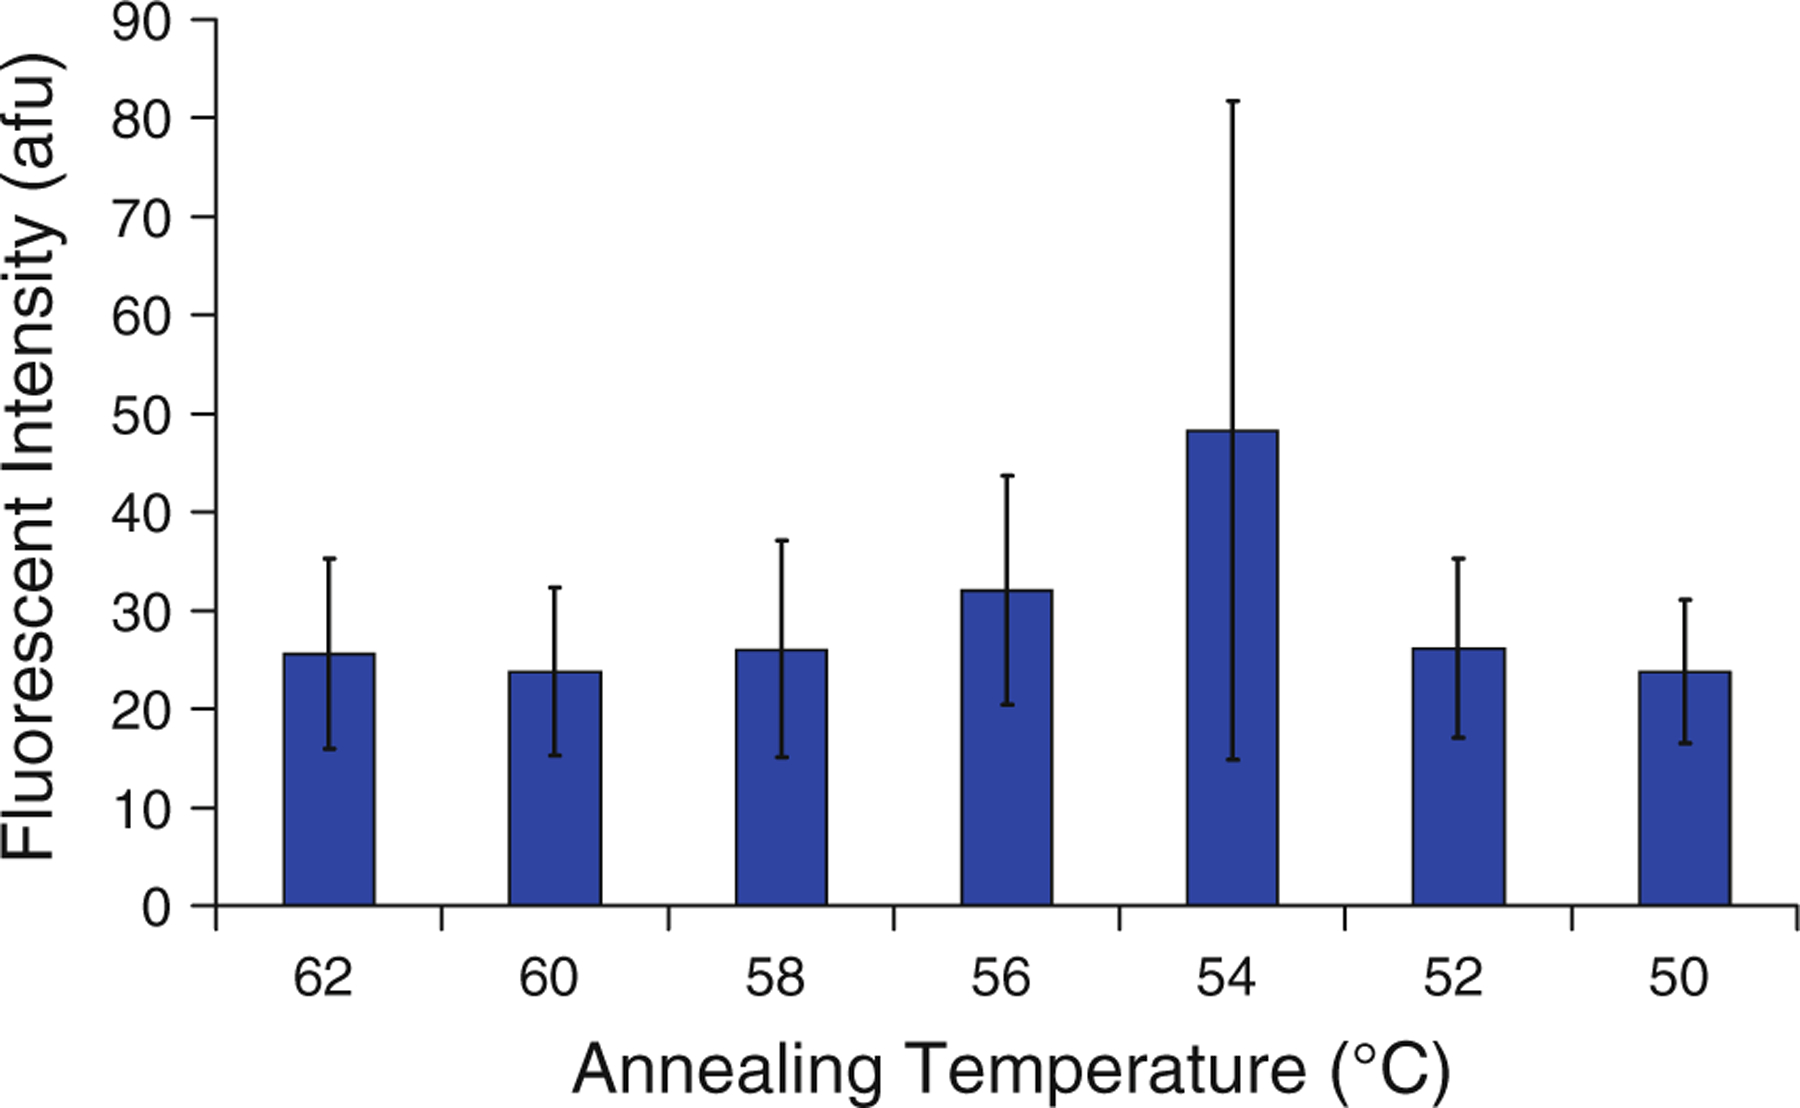
Effect of annealing temperature on fluorescent intensity after bead-based PCR, n = 3, with error bars representing one standard deviation from the mean
Official websites use .gov
A
.gov website belongs to an official
government organization in the United States.
Secure .gov websites use HTTPS
A lock (
) or https:// means you've safely
connected to the .gov website. Share sensitive
information only on official, secure websites.
Effect of annealing temperature on fluorescent intensity after bead-based PCR, n = 3, with error bars representing one standard deviation from the mean