
Fig. 9.
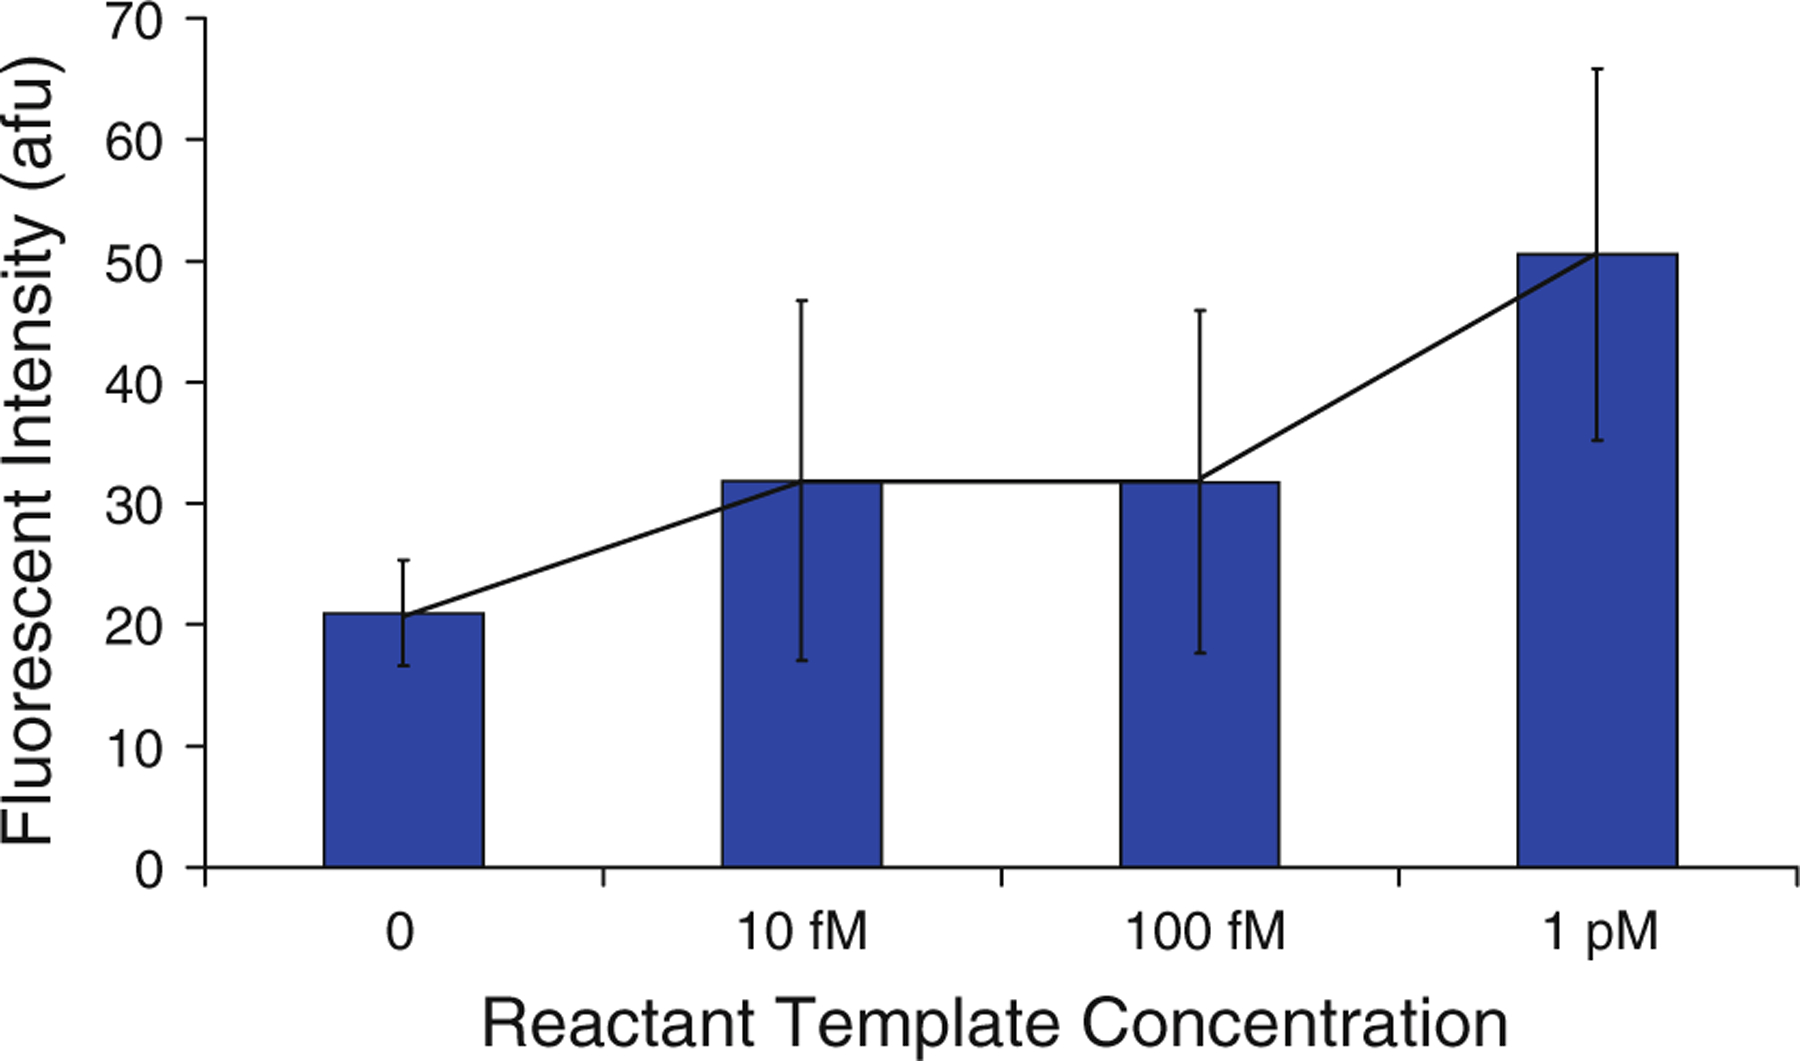
Investigation of DNA detection limit. Fluorescent intensity of beads following the PCR reactions is plotted against concentration of templates in the reaction mixture. Error bars indicate one standard deviation from the mean of three experiments (n = 3), and the reaction with zero templates (control) and a 1 pM template concentration (the detection limit) is differentiable with a probability of >95 %, according to the Student’s t test