
Fig. 6. Plots of the conductance variation as a function of the dissociation dwell time of l-amino acids.
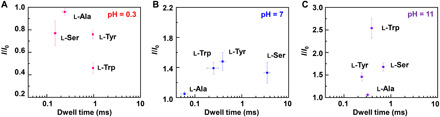
(A) pH = 0.3, (B) pH = 7, and (C) pH = 11, respectively. Each datum was derived from five separate working devices.
Official websites use .gov
A
.gov website belongs to an official
government organization in the United States.
Secure .gov websites use HTTPS
A lock (
) or https:// means you've safely
connected to the .gov website. Share sensitive
information only on official, secure websites.
(A) pH = 0.3, (B) pH = 7, and (C) pH = 11, respectively. Each datum was derived from five separate working devices.