
Fig. 4. Activation changes during temporal order recognition and association with memory performance at the 4-month retest.
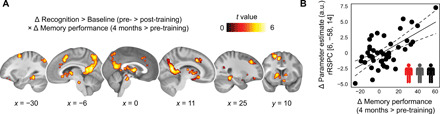
(A) Training study: Decreases in brain activation (recognition > baseline) from before to after training (pre- > post-training) that positively scaled with the change in free recall performance (referred to “memory performance” in the figure) from the pre-training session (20 min post-MRI) to the retest after 4 months (covariate of interest). Results are shown at P < 0.05 FWE-corrected at cluster level (cluster-defining threshold P < 0.001; see also table S4). (B) The scatterplot shows the relationship between the change in parameter estimates [arbitrary units (a.u.)] from the pre- to post-training sessions, extracted from the global maximum (right retrosplenial cortex, rRSPC; 8-mm sphere around MNI peak coordinate, x = 6, y = −58, z = 14), and the change in memory performance (4-month retest minus pre-training20 min). Given the clear inferential circularity, we would like to highlight that this plot serves visualization purposes only, solely illustrating the direction of association between the brain-behavior relationship.