
Fig. 5. Combined spectral and polarization imaging.
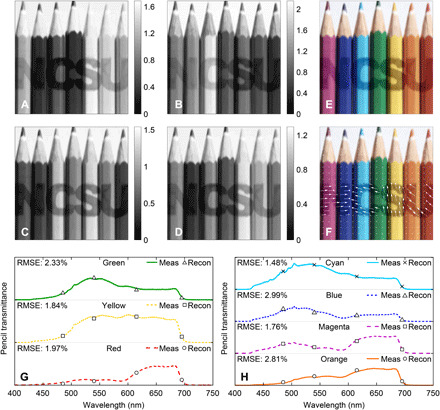
Spectral images from (A) OPV3, (B) OPV4, (C) OPV5, and (D) OPV6. (E) Color composite from the OPV detectors and (F) color image combined with polarization image where polarization is represented by the arrows. The measured and SIMPOL reconstruction of the pencils spectra for (G) green, yellow, and red pencils and (H) cyan, blue, magenta, and orange pencils. Photo credit of target image: Colin, CC-BY-SA-4.0 (58).