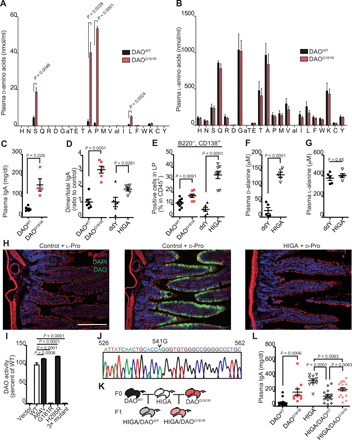
Fig. 2. DAO maintains l-aa homochirality and suppresses IgA production.

Blood d-aa (A) and l-aa (B) levels in DAOWT/WT and DAOG181R/G181R mice. Capital letters represent amino acids. “aT” and “aI” are allo-forms. (C) Plasma IgA levels in DAOWT/WT or DAOG181R/G181R mice. (D) The ratio of dimeric to total IgA analyzed by Western blot (n = 6 mice each). (E) IgA+ plasma cell percentage in the LP of SI (n = 8, 7, 6, and 8 mice); ddY, control. (F and G) Plasma free d-alanine (F) and l-alanine (G) in HIGA and ddY control mice (n = 5 mice each). (H) Activity-based labeling of DAO in SI of HIGA and control mice; active DAO (green), F-actin (red), nuclei (blue); scale bar, 100 μm. (I) Enzymatic activities of recombinant wild-type (WT), A64V, G181R, H295R, and triple-mutant DAO (n = 3). (J) Sequence electrograph showing a G541A point mutation (a G181R amino acid substitution) of DAO in HIGA mice. (K) HIGA mice were crossed with DAOWT/WT or DAOG181R/G181R mice. (L) Plasma IgA concentrations in parental and F1 mice (n = 16, 11, 10, 15, and 21 mice). Error bars, means ± SEM. Significance was analyzed with two-tailed unpaired t tests (A to G) and one-way analysis of variance (ANOVA) (I to L).
