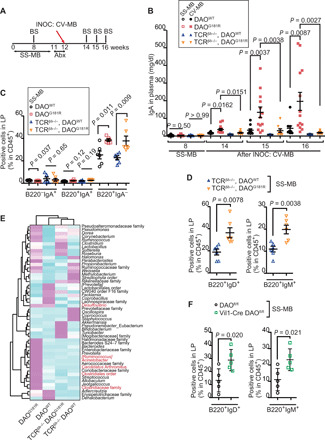
Fig. 4. Both TD and TI pathways contribute to IgA regulation by intestinal DAO.

(A) DAOWT/WT, DAOG181R/G181R, TCRβ−/−,δ−/−/DAOWT/WT, and TCRβ−/−,δ−/−/DAOG181R/G181R mice colonized with SS-MB were treated with antibiotics, followed by inoculation with CV-MB. (B) Plasma IgA levels before and after inoculation with CV-MB were analyzed with ELISA (n = 10, 13, 7, and 9, respective groups). (C) Percentage of IgA+/− B220+/− cells among CD45+ cells in SI LP (n = 6, per group). (D) Percentages of naïve B cells among CD45+ cells in the SI LP at 8 weeks of age (n = 6, per group). (E) Abundance of IgA-coated bacteria on SI microbiota in mice colonized with CV-MB is depicted as averaged z scores. Taxa shown in red differ significantly among the four groups. (F) Percentages of naïve B cells in SI LP of DAOflox/flox and Vil1-Cre+/−/DAOflox/flox mice colonized with SS-MB (n = 5, per group). Error bars, means ± SEM. Significance was analyzed with two-tailed unpaired t tests (C, D, and F) and Kruskal-Wallis tests (B).
