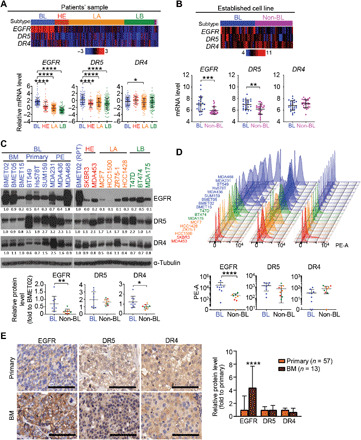
Fig. 1. EGFR and DR4/5 are up-regulated in BLBC-BM.

(A) Top: Heatmap of mRNA levels of EGFR, DR5, and DR4 in patient samples of four subtypes (BL, basal-like; HE, HER2-enriched; LA, luminal A; LB, luminal B) of BC from TCGA database (n = 526). Bottom: Comparison of EGFR, DR5, and DR4 mRNA levels between subtypes. (B) Top: Heatmap of mRNA levels of EGFR, DR5, and DR4 in cell lines of BLBC or non-BLBC from TCGA database (n = 52). Bottom: Comparison of EGFR, DR5, and DR4 mRNA levels between subtypes. (C) Top: Western blot (WB) of EGFR, DR5, and DR4 in 18 BC cell lines (PE, pleural effusion; RPT, repeat; loading control–adjusted ratios are provided under blots). Bottom: Relative expression of EGFR, DR5, and DR4 in BLBC and non-BLBC. (D) Top: Cell surface protein levels of EGFR, DR5, and DR4 analyzed by flow cytometry in 18 BC cell lines. Bottom: Comparison of cell surface expression of EGFR, DR5, and DR4 in BLBC and non-BLBC. PE-A, phycoerythrin-area. (E) Left: Representative micrograph of immunohistochemistry of EGFR, DR5, and DR4 in primary tumors and BM of TNBC. Scale bars, 100 μm. Right: Quantifications of immunohistochemical staining densities by ImageJ (primary, n = 57; BM, n = 13).
