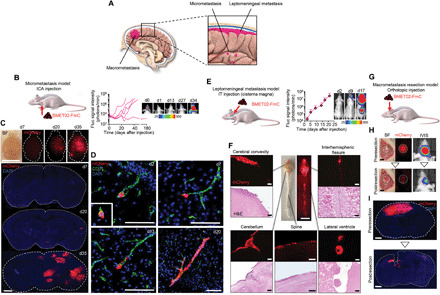
Fig. 2. Developing and characterizing clinically relevant mouse models for BLBC-BM.

(A) Schematic representation of three clinical scenarios of BM. (B) Left: Schematic of micrometastasis model. Right: BLI signal curves of each mouse after ICA injection of BMET02-FmC and representative pictures. (C) Top: Chronological representative bright-field (BF) and fluorescence photographs of brain samples from ICA-injected BMET02-FmC–bearing mice. Scale bar, 10 mm. Bottom: Photomicrograph of coronal sections of the samples. Scale bar, 1 mm. (D) Chronological photomicrographs of immunohistochemistry of CD31 in brain sections that had ICA injection of BMET02-FmC. Scale bars, 100 μm. Critical moment of extravasation of cancer cells was observed on day 2 (inset of d2). (E) Left: Schematic of leptomeningeal metastasis model. Right: BLI signal curve of IT-injected BMET02-FmC–bearing mice (n = 2) and representative photographs. (F) Center: Representative photograph of brain and spine samples from mice 23 days after IT injection of BMET02-FmC. Scale bar, 10 mm. Surrounding: Representative microphotograph of fluorescence and hematoxylin and eosin (H&E) staining of the brain and spine samples. Scale bars, 100 μm. (G) Schematic of macrometastasis resection model. (H) Left: Representative intraoperative BF and fluorescence photographs of brain of pre- and postresection of BMET02-FmC tumor. Scale bars, 1 mm. Right: Representative pictures of BLI. (I) Representative photomicrograph of brain sections of pre- and postresection of tumor. Scale bars, 1 mm. Photo credit: Yohei Kitamura, Brigham and Women’s Hospital. DAPI, 4′,6-diamidino-2-phenylindole.
