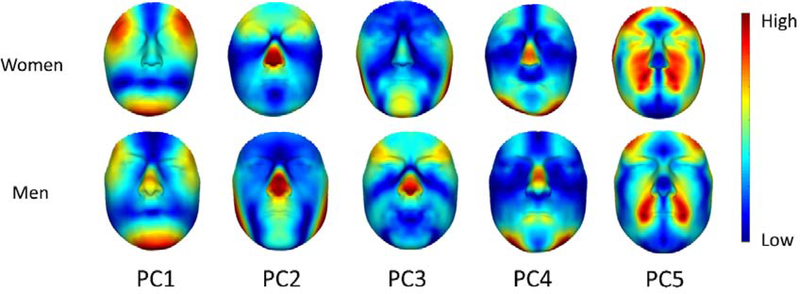
Figure 2.
Heat map of the first five PCs of C-FA for both males and females. Each column represents a different dimension of variation of FA in women and men separately. The blue color indicates no FA in those regions, and going towards red means more FA. We can see that the patterns of variation in the PCs corresponds between the two groups, except for PC2 and PC3, which have switched places between men and women (PC2 in women corresponds to PC3 in men, and PC2 in men corresponds to PC3 in women). The variations are amplified for visual purposes.

