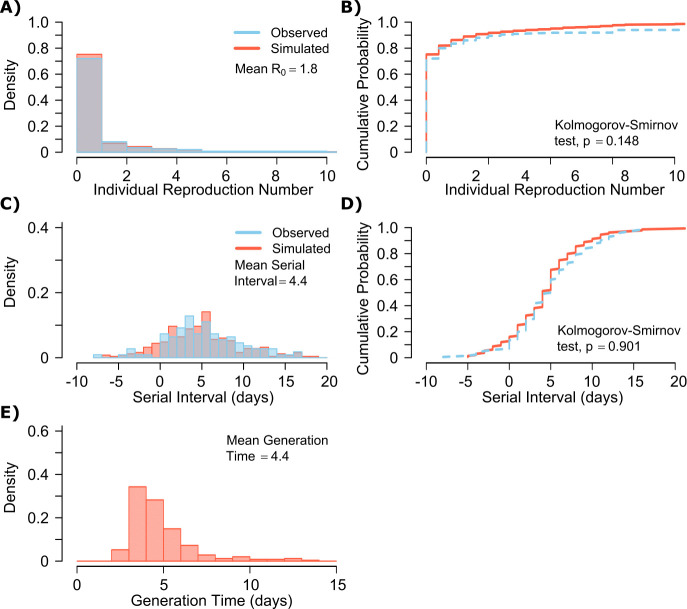
Figure 2. SARS-CoV-2 transmission model fit.
(A) Simulated and actual frequency histograms of individual R0 values, (Endo et al., 2020) (B) Simulated and actual cumulative distribution of individual R0 values. (C) Simulated and actual frequency histograms of individual serial intervals, (Du et al., 2020) (D) Simulated and actual cumulative distribution of individual serial intervals. (E) Frequency distribution of simulated generation times.
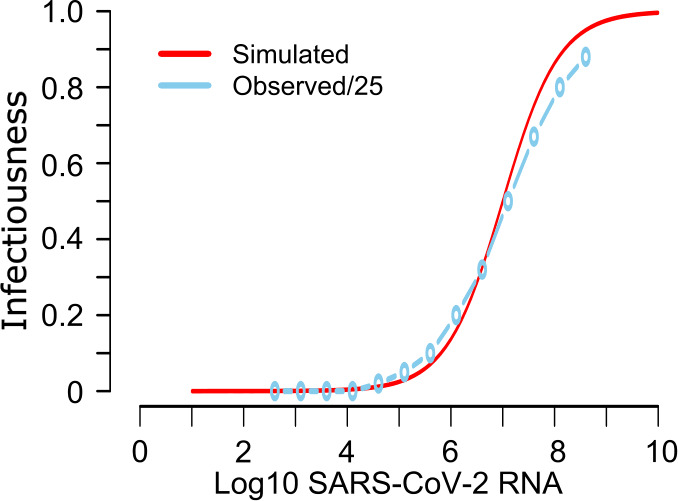
Figure 2—figure supplement 1. Mathematical model recapitulation of relationship between SARS-CoV-2 viral load and viral culture.


