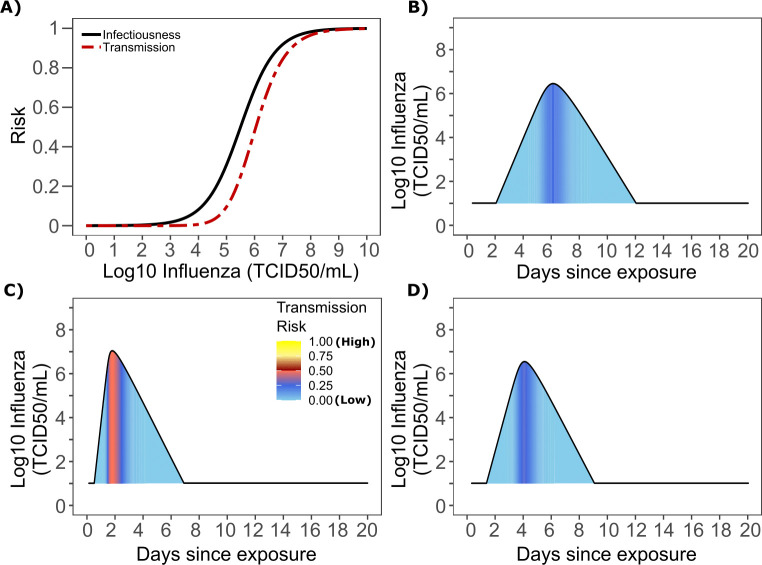
Figure 7. Influenza transmission probability as a function of shedding.
(A) Optimal infectious dose (ID) response curve (infection risk = Pt) and transmission dose (TD) response curve (transmission risk = Pt * Pt) curves for influenza. Transmission probability is a product of two probabilities, contagiousness and infectiousness (Figure 1). (B-D) Three simulated viral shedding curves. Heat maps represent risk of transmission at each shedding timepoint given an exposed contact with an uninfected person at that time.

