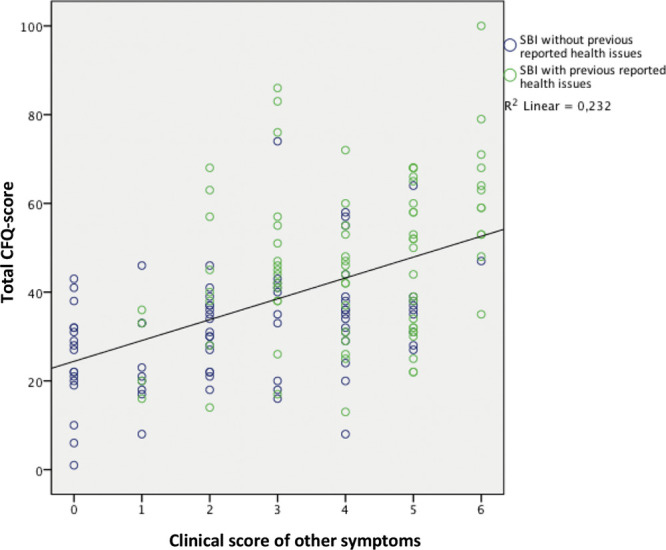
Fig. 3.

Relationship between total CFQ-scores and other clinical symptoms in SBI patients. Linear regression: the y axis represents the value of the CFQ-scores, values range from 1 to 100: a high CFQ-score was defined as a score ≥43. The x axis represents the clinical score, which was calculated by summing up the amount of other symptoms (range 0–6). The blue circles in the scatterplot represent the SBI patients without previous reported health issues (group 1), and the green circles represent the SBI patients with previous reported health issues (group 3). The black line is the linear regression with a regression coefficient of 4.698 ± 0.68 and an R2 of 0.232 ± 15.32 (P = 0.000).
