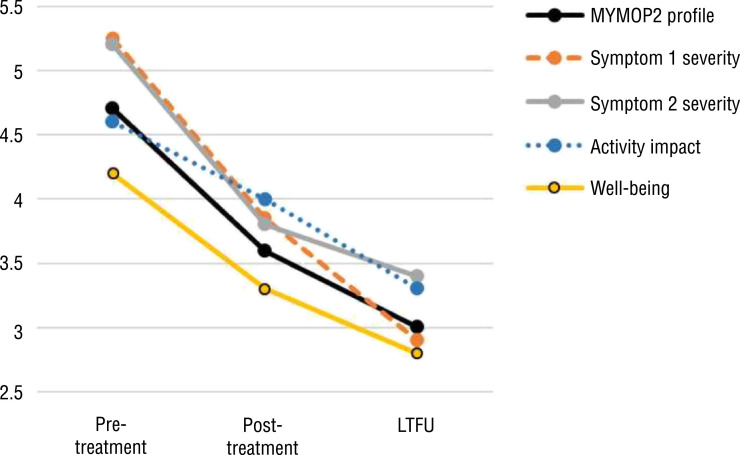
Figure 1.
Symptom well-being outcome as assessed at multiple time points using the MYMOP2 among participants with LTFU (N = 27)
Note. Lower scores indicate improvements in outcome. The MYMOP2 profile score is the mean of the four subscales. All change values were significant from pretreatment to LTFU (p ≤ .004) and from posttreatment to LTFU (p ≤ .05) except for Symptom 2 severity at posttreatment to LTFU (p = .2). Effect sizes were medium to large, ranging from −0.8 to −1.3 for pretreatment to LTFU and −0.4 to −0.7 for posttreatment to LTFU. LTFU = 1-yr long-term follow-up; MYMOP2 = Measure Yourself Medical Outcome Profile

