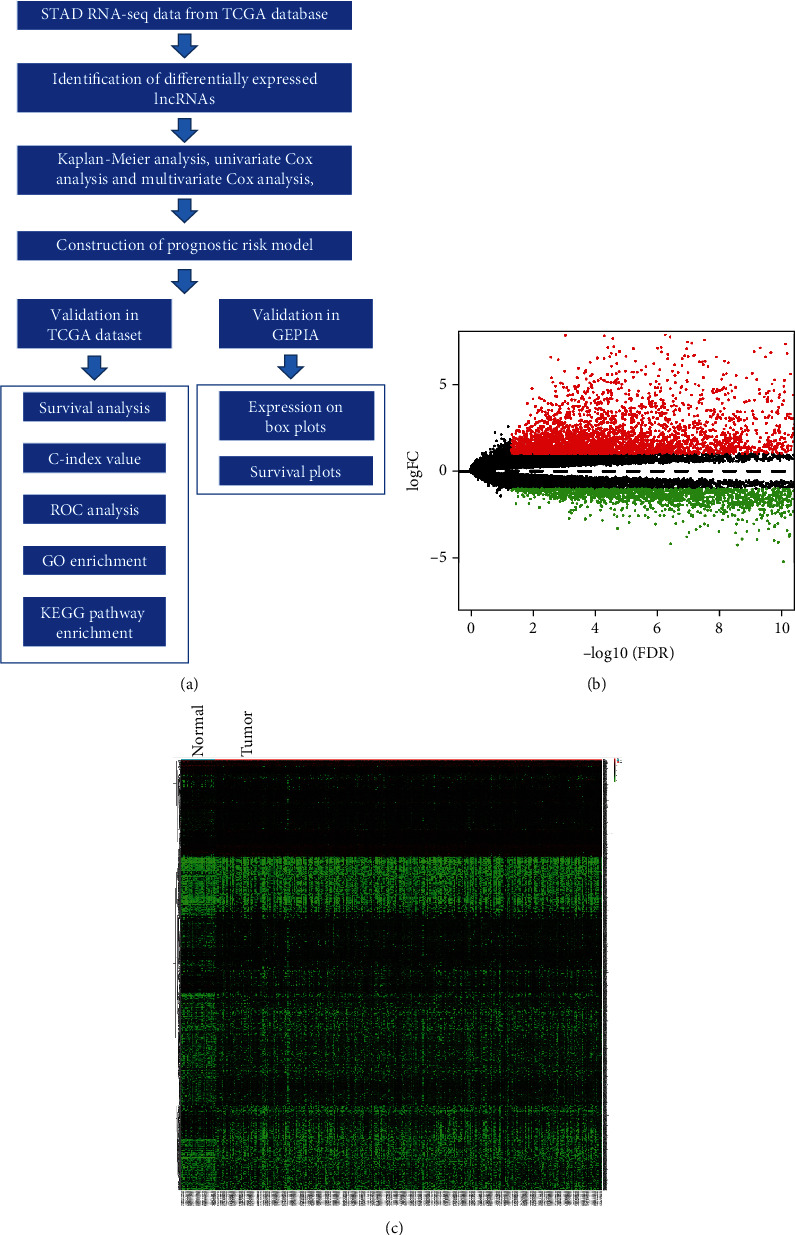
Figure 1.

Identification of differentially expressed lncRNAs (DElncRNAs) in stomach adenocarcinoma patients. (a) The main flowchart of the current study. The data was retrieved from TCGA database. Differentially expressed lncRNAs were compared between 343 stomach adenocarcinoma tissues and 30 adjacent nontumoral tissues. (b) Volcano map of DElncRNAs. Red plots demonstrate upregulated lncRNAs, while green plots demonstrate downregulated lncRNAs. (c) Heatmap of the DElncRNAs between tumor tissues and adjacent nontumoral tissues. Red, black, and green colors represent the relatively high, medium, and low expression of lncRNAs, respectively. STAD: stomach adenocarcinoma; TCGA: The Cancer Genome Atlas; ROC: receiver operating characteristic curve; GO: Gene Ontology; KEGG: Kyoto Encyclopedia of Genes and Genomes; GEPIA: Gene Expression Profiling Interactive Analysis.
