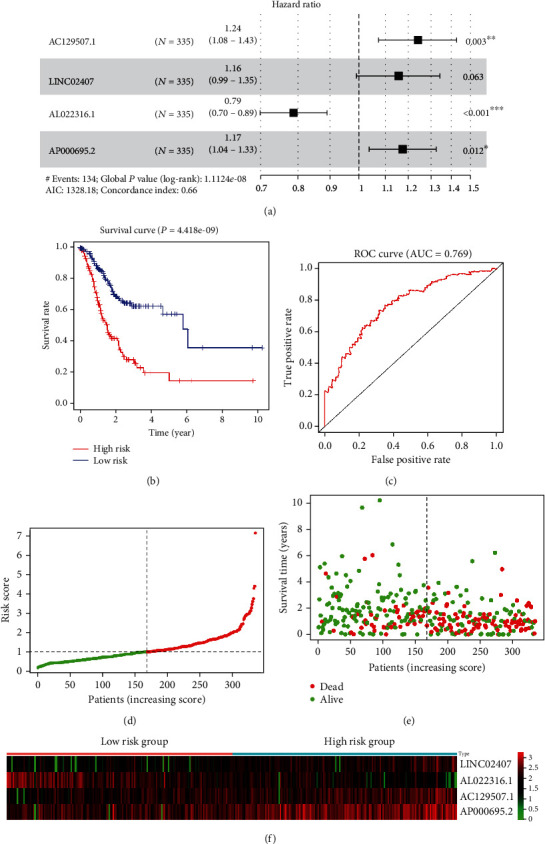
Figure 2.

Construction and performance of a prognostic risk model. (a) Multivariate Cox regression analysis and forest plots demonstrate that key DElncRNAs could be viewed as independent prognostic biomarkers. (b) Kaplan-Meier curves demonstrate the difference between the high-risk group and low-risk group in OS based on the prognostic risk model. (c) ROC analysis of the prognostic risk model. (d) Scatter diagram shows the distributions of risk scores of STAD patients. (e) Scatter diagram shows the survival status of the patients based on this prognostic risk model. (f) Heatmap of the 4 prognostic lncRNA expression profiles.
